Key Fundamental Factors Affecting the Financial Market

Fundamental factors are like puzzle pieces that shape the big picture of the financial world. These factors can influence the value of assets such as currency pairs, stocks, commodities, and even cryptos. In this article, we will uncover such key factors, which often create opportunities for intelligent investors and traders.

  • Geopolitical events:

Geopolitical factors like wars, elections, trade deals, or conflicts can cause ripples in the markets. Positive events can boost investor confidence, while negative news can trigger uncertainty. You are highly recommended to stay updated on global affairs to anticipate how they might impact your trades.

  • Economic indicators:

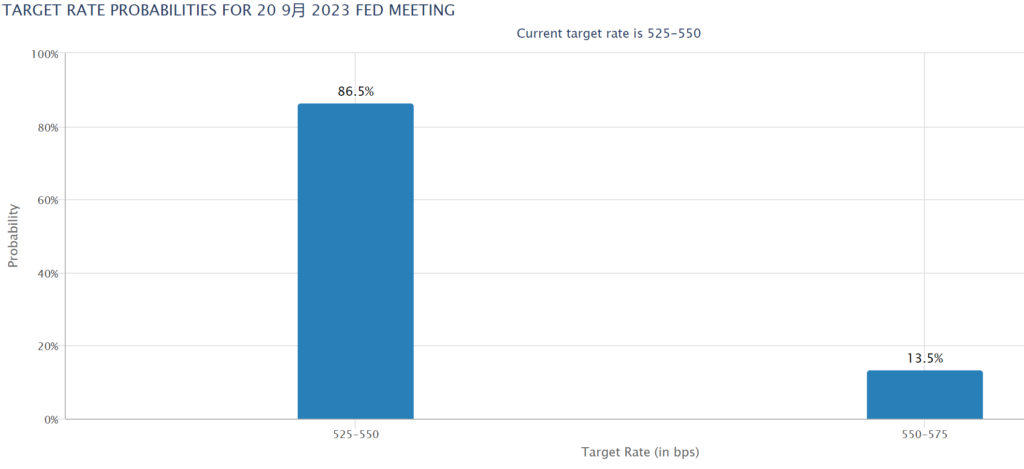
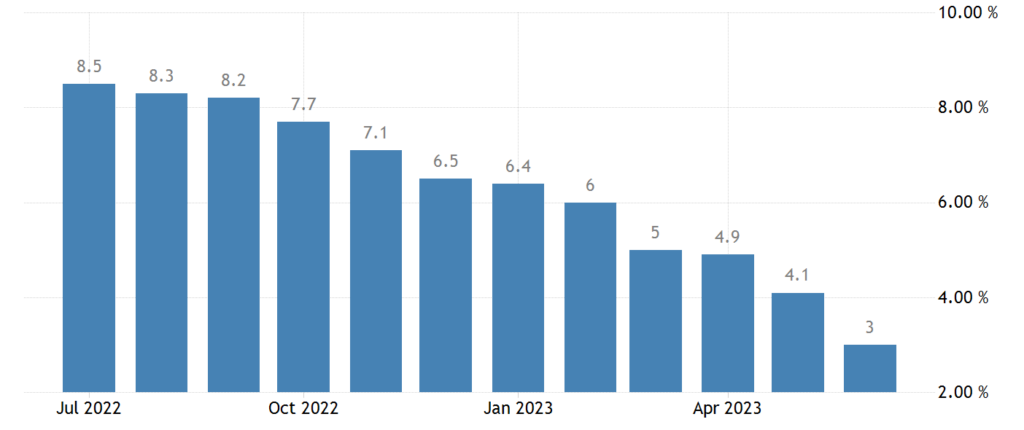
Economic indicators are like the scoreboard, showing the health of a country’s economy. When GDP (Gross Domestic Product) goes up, it’s a sign of economic strength. Low unemployment rates mean people have jobs and money to spend. Inflation, the rise in prices, affects consumers’ buying power. And interest rates set by central banks can make borrowing cheaper or pricier. These indicators affect market sentiment, and understanding them gives you an edge.

  • Corporate earnings:

Corporate earnings can reveal how well a company is doing. Strong earnings mean the company is making money, which can lead to higher stock prices. Keep an eye on quarterly reports and profit margins – they’re your insider’s ticket to predicting movements of stocks and indices.

  • Natural disaster or climate events:

Imagine you’re a scientist observing nature’s forces. Natural disasters like hurricanes, earthquakes, or droughts can disrupt supply chains and affect commodity prices. Climate events, like changing weather patterns, impact agricultural products. Keeping an eye on these factors helps you anticipate potential market shifts.

  • Market sentiment:

Imagine you’re a scientist observing nature’s forces. Natural disasters like hurricanes, earthquakes, or droughts can disrupt supply chains and affect commodity prices. Climate events, like changing weather patterns, impact agricultural products. Keeping an eye on these factors helps you anticipate potential market shifts.

Summary

By understanding fundamental factors, you can predict how the market might change. For example, if an economic indicator suggests a strong economy, you might expect stock prices to rise. If geopolitical tensions increase, currencies might fluctuate.

In a word, fundamental factors are the driving forces behind price movements. Understanding them will give you a competitive edge.

Introduction to Fundamental Analysis

If you are eager to understand the magic behind the financial markets, look no further than fundamental analysis! It’s time to unlock this exciting aspect of CFD trading and show you how to take advantage of it like a pro.

What Is Fundamental Analysis?

Fundamental analysis is all about exploring the real factors that drive the prices of financial assets like currency pairs, stocks, commodities, or cryptos. Unlike technical analysis, fundamental analysis focuses on the big picture, considering economic, financial, and geopolitical factors that influence an asset’s value.

Key Factors in Fundamental Analysis

  • Geopolitical Events:

Geopolitical events, like elections, trade deals, or conflicts, can cause turbulence in the financial markets. They play a role in shaping investors’ confidence and affecting asset prices. Keep an eye on global news and how it impacts the markets.

  • Economic Indicators:

Economic indicators are like clues that help you understand the health of a country’s economy. Key indicators include GDP (Gross Domestic Product), employment rates, inflation, and interest rates. When these indicators show a strong economic signal, asset prices might rise. But if they reveal weakness, prices could fall.

  • Company Performance:

If you’re trading CFDs on individual stocks, it’s essential to investigate the companies behind them. Look into their financial reports, earnings, and growth prospects. A company with solid earnings and exciting projects may attract more investors, boosting its stock price. But beware of companies facing challenges, their stock prices might take a dip.

Summary

Fundamental analysis is key to revealing the hidden treasures of the financial markets. It can help you understand the true value of assets and the factors that drive their prices. By combining fundamental analysis with technical analysis, you will be well-equipped to tackle the thrilling world of CFD trading.

Gold strengthened on bright retail sales numbers

Focus on gold.

Fundamentally speaking, the US released retail sales in July increased by 0.7% mom. The figure for June was also revised up to 0.3% from 0.2%, suggesting the U.S. economy continued to expand in 3Q and avoid recession. Consequently, inflation stays still in the short run.  With demand remaining resilient and labor market tightening, curbing inflation has become a tricky problem for the FED. We believe gold is heading for a bounce.

Technically speaking, the gold daily has come to a key support zone – the 240-day moving average .

(Gold daily cycle, Ultima Markets MT4)

The 240-day moving average has been a supportive position for gold since 2022. The gold price made small fluctuations in the supportive zone during the past week, nevertheless, the stochastic oscillator signaled a golden cross yesterday.

(Gold in 1- hour period, Ultima Markets MT4)

In 1-hour period, the gold price went down again after stepping back on the 65 – period moving average yesterday, but it did not fall below the previous low. Looking at the overall structure, the gold price has a probability of forming a bottom structure. After the price breaks through the previous suppressed position, please make sure if the ATR combination indicator shows an effective breakthrough.

(Gold in 1- hour cycle, Ultima Markets MT4)

According to the pivot indicator in Ultima Markets MT4, the central price is 1902.54,

Bullish above 1902.54, the first target is 1909.10, and the second target 1917.99.

Bearish below 1902.54, the first target is 1893.94, and the second target 1887.37.

Disclaimer Comments, news, research, analysis, price, and all information contained in the article only serve as general information for readers and do not suggest any advice. Ultima Markets has taken reasonable measures to provide up-to-date information, but cannot guarantee accuracy, and may modify without notice. Ultima Markets will not be responsible for any loss incurred due to the application of the information provided.

Spread between Europe and the US pressed on the euro

Focus on EUR/USD.

Fundamentally speaking, although Fed’s rate hike coming to an end, the U.S. dollar index continues to rise. According to data released by the CFTC last week, the short positions fell to the lowest level in eight weeks. Short-covering is fueling a rebound in the U.S. dollar index as hedge funds continue to trim their short positions.

(US 10 -Year Treasury Yield vs EU 10 -Year Treasury Yield)

During the tightening monetary cycle, the spread of long-term bonds between the United States and Europe drives arbitrage funds to buy dollar and sell euro. In the short term, the spread deliveries adjustments to the exchange rate.

Technically speaking, the EUR/USD daily cycle completed a breakout of last Friday’s low yesterday. The market has a high probability of ushering in a downward trend in the next two days.

(EUR/USD daily cycle, Ultima Markets MT4)

The exchange rate fell below multiple moving averages and was blocked by the 61.8% golden ratio Fibonacci retracement position yesterday. Today there is a certain probability of stepping back on the moving average or consolidating prices, but if today’s market continues to fall below yesterday’s low, the euro will remain weak against the dollar.

(EUR/USD daily cycle, Ultima Markets MT4 )

From the perspective of daily structure, there are two key support positions below the level, 1.0836 is the potential target, and 1.0639 is the extremely critical long-short boundary. If all supportive levels are crushed, a deep correction will come along.

(EUR/USD in 4 -hour cycle, Ultima Markets MT4)

In 4- hour cycle, bull and bear are in entanglement. The Stochastic Oscillator displays a golden cross to indicate the bull, but the exchange rate maintains a downward trend. It means that the decline is not firm enough, and the rebound is still strong.

(EUR/USD in 1- hour cycle, Ultima Markets MT4)

In 1- hour cycle, the price still has the probability of stepping back on the moving average and resistance level. If Stochastic Oscillator shows a dead cross later on, please look for short trading opportunities.

According to the pivot indicator in Ultima Markets MT4, the central price is 1.09147,

Bullish above 1.09147, the first target is 1.09537, and the second target 1.09993.

Bearish below 1.09147, the first target is 1.08680, and the second target 1.08284.

Disclaimer

Comments, news, research, analysis, price, and all information contained in the article only serve as general information for readers and do not suggest any advice. Ultima Markets has taken reasonable measures to provide up-to-date information, but cannot guarantee accuracy, and may modify without notice. Ultima Markets will not be responsible for any loss incurred due to the application of the information provided.

Unraveling the RBNZ Interest Rate Decision and its Implications

RBNZ might hold rates unchanged while institutions short on NZD

The Federal Reserve Bank of New Zealand will announce the latest interest rate decision on Wednesday, and the market expects to keep the OCR official cash rate unchanged at 5.50%.

At the moment, global economics are cooling, while the figures released by RBNZ are not strong enough.

Consequently, RBNZ gains space to keep interest rates unchanged and time to observe the inflation situation further.


The Intricacies of the New Zealand Economy

NZ economic data displays a mixed picture, with inflation data tapering off despite resilient demand, leaving investors conflicting signals. NZ economic conditions have not weakened as badly as previously expected.

(NZ inflation rates in one year)

Although inflation has started to fall, it has remained high. The strong labor market has prompted RBNZ to postpone an expected rate cut originally scheduled for the fourth quarter of 2023 until the second quarter of 2024.

The wage growth has declined, however, stayed at an elevated level, hampering RBNZ to reach its inflation goal. NZ’s GDP growth rate is expected to pick up slightly in 2023, showing some resilience in its economy.

(NZ job vacancies decreased since July 2022)


The Uncertainty Surrounding OCR

A ‘watch, worry, and wait’ stance seems the most likely outcome of the OCR review. However, some institutions believe it is possible to see rates go up to 5.75% in the future. The divergence reflects market uncertainty toward inflation and the economic outlook.

(Institutional short positions increased on NZD/USD)

The positions held by Institutional investors last week showed bearish sentiments on NZD/USD. If RBNZ unexpectedly raises interest rates, NZ’s exchange rate will rise rapidly in the short run.

(NZD/USD weekly chart, Ultima Markets MT4)


Institutional Sentiments on NZD/USD

From a technical standpoint, the NZD /USD weekly cycle has fallen into short-term weakness, and the bottom is about to look at the Fibonacci 61.8% retracement position of the upward trend since September 2022.


The Crucial Role of Data and Monetary Policy

In conclusion, the outcome of the RBNZ’s decision hinges significantly on a blend of mixed economic data, inflation trends, and the broader economic outlook.

Investors are well-advised to keep a keen ear out for the central bank’s commentary on inflation and the overall state of the economy during the review.

Furthermore, observing the subsequent market response will provide invaluable insights into the trajectory of New Zealand’s monetary policy.


Disclaimer

Comments, news, research, analysis, price, and all information contained in the article only serve as general information for readers and do not suggest any advice. Ultima Markets has taken reasonable measures to provide up-to-date information, but cannot guarantee accuracy, and may modify without notice. Ultima Markets will not be responsible for any loss incurred due to the application of the information provided.

The Thrilling Rollercoaster: Oil Prices in Turmoil

Oil, A Fiery Tale of Supply and Demand

Last week, the reports released by the three major oil organizations gave investors a better understanding of the short-term crude oil market. After oil prices have been rising for some time, major adjustments are expected this week.

The Dynamics of Demand and Supply

In June 2023, global daily oil demand broke a record at 103 million barrels and is still expected to hit a peak in August.

According to the IEA, demand for crude from the 13 OPEC members averaged 29.8 million barrels per day in the October-December period, much higher than the 27.9 million barrels expected in July.

The OPEC monthly report shows that the growth rate of global crude oil demand in 2023 is expected to remain unchanged at 2.44 million barrels per day.

(Net long positions lifting oil prices, OPEC monthly report)

However, global oil supply fell by 910,000 barrels in July, mainly due to Saudi production cuts. Currently, crude oil inventories in developed countries are about 115 million barrels below the five-year average.

That suggests an increasingly tight market, partly due to falling supply. In 2H2023, the IEA forecasts a reduction in global inventories of about 1.7 million barrels per day, suggesting further tensions in the market could result in a bigger impact to prices.


Production Cuts and Their Impact

One of the standout factors contributing to the evolving oil market landscape is the strategic moves made by key oil-producing nations. Saudi Arabia’s unilateral production cuts and Russia’s reduced exports have jointly pushed the output of OPEC+ members to a nearly two-year low. This concerted effort to manage production has played a pivotal role in shaping the current scenario.


Unbalance between supply and demand leading price to swing

Oil prices maintained a steady uptrend in July. From an export standpoint, the export price of Russian crude has risen sharply, with an increase of US$ 8.84 per barrel, and the total price reached US$ 64.410.

Still, Russia’s oil revenues are down by more than a fifth from a year earlier, according to the IEA. However, technically speaking, crude prices will face an adjustment in the short run.

(Daily chart of Brent crude, Ultima Markets MT4)

Based on the daily chart shown above, crude price has reached the important resistance area of 87-88 US dollars. The Stochastic Oscillator is also showing divergence as the price keeps trying to move above this resistance zone.

(1- hour chart of Brent crude, Ultima Markets MT4)

In the 1- hour period, the short-term moving average has completely declined, and the medium- and long-term moving average has completely fallen too, and the oil price has also made an effective correction. There is a certain downward pressure on oil prices within the day, and the bottom is looking at the upward trend line.

Overall, oil prices will see some downward pressure in the short run. However, with production cuts and stable demand growth, oil prices still have the momentum to rise this year.


Future Outlook

In conclusion, the oil market is poised to experience short-term downward pressure, influenced by the factors we’ve explored. However, the overarching dynamics, characterized by production cuts and a stable growth in demand, suggest that oil prices still possess the momentum for a potential rise in the year ahead.

It’s important to note that the oil market is susceptible to a multitude of variables and is subject to frequent changes. As an investor or observer, it’s crucial to stay informed about the latest developments and insights to make informed decisions in this ever-evolving market.


Disclaimer

Comments, news, research, analysis, price, and all information contained in the article only serve as general information for readers and do not suggest any advice. Ultima Markets has taken reasonable measures to provide up-to-date information, but cannot guarantee accuracy, and may modify without notice. Ultima Markets will not be responsible for any loss incurred due to the application of the information provided.

Seeing clear sky if euro breaks through

Focus on EUR/USD.

On fundamentals, last week PMI figures in the euro zone reconfirmed the pressure on the European economy, with the manufacturing sector recording 42.7 in July, the lowest manufacturing PMI since 2020. The PMI for the services sector was revised down to 50.9 in July, the lowest up to date. In this context, the market’s expectation for the end of the ECB interest rate hike has fallen from the high of 3.95% in July to the current 3.8%. Investors can wait for the market to digest the interest rate difference between Europe and the United States, and then pay attention to the impact of more economic data on the future.

Technically speaking, in EUR/USD daily cycle, the short-term moving averages formed by the 15-day and 21-day suppressed the rise of the exchange rate in the short run. Although it fell below Monday’s low yesterday, there are still bullish opportunities.

(EUR/USD daily cycle, Ultima Markets MT4)

The stochastic oscillator formed a golden cross gesture last week, and there is a bullish potential, but it can only be clarified after the suppression of the short-term moving averages reverses.

(EUR/USD 4 -hour cycle, Ultima Markets MT4)

In the 4- hour cycle, the exchange rate doesn’t form an effective long structure, and still needs to wait for the confirmation of moving averages and price actions. It is necessary to watch out for any bearish strike in the short term.

(EUR/USD 1 -hour cycle, Ultima Markets MT4)

According to the pivot indicator, the central price of the day is 1.09612,

Bullish above 1.09612, the first target is 1.09956, and the second target 1.10437.

Bearish below 1.09612, the first target is 1.09140, and the second target 1.08813.

Disclaimer

Comments, news, research, analysis, price, and all information contained in the article only serve as general information for readers and do not suggest any advice. Ultima Markets has taken reasonable measures to provide up-to-date information, but cannot guarantee accuracy, and may modify without notice. Ultima Markets will not be responsible for any loss incurred due to the application of the information provided.

GBP/AUD looks out for bears

Focus on GBP/AUD today.

On fundamentals, there is no notable financial data due today. The difference in monetary policy between the UK and Australia will control the currency exchange rate in the short run.

(Blue vs Black, BoE rate vs RBA rate)

The BoE raised its benchmark interest rate by 25 bps to the highest level of 5.25% since 2008. At the same time, the RBA’s is currently set at 4.1%. The interest rate differential means room for arbitrage. AUD is deemed as a commodity currency, inherently vulnerable to commodity prices. The market is positive about RBA rate hikes, resulting in a bullish view of AUD.

Technically speaking, the GBP/AUD daily cycle structure presents a potential Wolf Wave structure. However, the current price action structure does not show a clear bearish structure.

(GBP/AUD daily cycle, Ultima Markets MT4)

The daily price action has room to rise — support is found on the 33-day moving average. The exchange rate fluctuated on the 5-day moving average for three days and stopped falling with three lower shadows. Still, we need to be alert. The stochastic oscillator has been entangled, and the upper resistance line is not far away. The market may reverse at any time.

(GBP/AUD 1 -hour cycle, Ultima Markets MT4)

On the hourly chart, GBP/AUD has formed a clear rectangular range after three days of swinging. Yesterday’s breakthrough suggested that bulls are more dominant in the short run. However, judging from the ATR combination indicators, it is doubtful whether the market breakthrough is effective. From a technical standpoint, GBP/AUD looks bullish, however, the sentiment may quickly change.

(GBP/AUD 1- hour cycle, Ultima Markets MT4)

According to the pivot indicator in Ultima Markets MT4, the central price of the day is 1.94141,

Bullish above 1.94141, the first target is 1.94943, and the second is 1.95451.

Bearish below 1.94141, the first target is 1.93626, and the second is 1.92806.

Disclaimer

Comments, news, research, analysis, price, and all information contained in the article only serve as general information for readers and do not suggest any advice. Ultima Markets has taken reasonable measures to provide up-to-date information, but cannot guarantee accuracy, and may modify without notice. Ultima Markets will not be responsible for any loss incurred due to the application of the information provided.

Analyzing U.S. Nonfarm Payrolls and Its Impact on the Dollar

The non-farm payrolls have passed, the inflation data has come, and the dollar is still in decline

Last Friday, August 4th, the U.S. nonfarm payrolls data fell short of expectations for the second consecutive month. According to the data released by the U.S. Department of Labor, the seasonally adjusted non-agricultural employment in the United States increased by 187,000 in July, the lowest number of new jobs since December 2020, compared with market expectations of 200,000.


Nonfarm Payrolls: A Disappointing Trend

Previously, new job figures for May and June were revised down as well. The May’s number was revised down from 339,000 to 306,000 and the June’s down to 185,000.

It is worth noting that ADP, the identical twin of non-agricultural employment data, also showed a downward trend in August, and this time it did not show the opposite trend to the nonfarm payrolls data.

The divergence in the first two months made the reference value of ADP to decrease.

(Blue column vs black line; non-farm payrolls vs ADP)


Unemployment Rate and Hourly Wages

On the other hand, the unemployment rate eased to 3.5% from 3.6 % in June. In addition, the hourly wage continued to record steady growth in July, increasing by 4.4% year-on-year, beating expectations of 4.2%. The increase in hourly wages may not be what the FED wants to see because of its 2% inflation target.


FED’s Role in the Labor Market

Elon, analyst at Ultima Markets Investment Research Group, said “In general, the FED’s continued tightening policy has begun to take effect in the labor market, and the decline in the number of new jobs for two consecutive months represents the beginning of cooling job market. As a result, the consensus for rate hike in September has not changed significantly.

(The chance that the Fed will not raise interest rates stays at nearly 90%, sourced from the Fed Interest Rate Observation Tool)


Impact on Gold and Non-U.S. Currencies

Gold and non-US currencies altogether is happy with the expectation of the Fed’s move to leave interest rates unchanged. It is important to watch out for inflation data this week. Last month, the inflation rate returned to 3%. If the inflation continues cooling, the dollar will go downwards again.

(CPI rates in one year)


Technical Analysis of the Euro

Technically, the euro finds its support on the back of 1.09, rising above the 65-day moving average and the 5-day moving average again. The Stochastic Oscillator is also showing a golden cross gesture, suggesting an underlying bullish trend. If the euro breaks through the peak last week, it will expectedly resume an uptrend.

(Daily chart of EUR/USD, Ultima Markets MT4)


Disclaimer

Comments, news, research, analysis, price, and all information contained in the article only serve as general information for readers and do not suggest any advice. Ultima Markets has taken reasonable measures to provide up-to-date information, but cannot guarantee accuracy, and may modify without notice. Ultima Markets will not be responsible for any loss incurred due to the application of the information provided.

GBP/AUD changing game is on

Focus on GBP/AUD today.

On Fundamentals, BoE raised its benchmark interest rate by 25 bps yesterday, reaching the highest level since 2008. Rising interest rates mean higher borrowing costs, meaning more pressure on many homeowners. The UK continues to be on the edge of recession. Separately, RBA’s monetary report suggests suspending interest rate hikes, however, leaves room for another 15-bps raise.

BoE’s monetary policy was significantly more hawkish than RBA’s, resulting in an appreciation of GBP/AUD since February 2023. However, BoE’s policy no longer brought bullish sentiment on the pound but worries on the British outlook. At present , the market is certian on the future peak interest rate of the RBA, which will lead to a potential bullishness on the Australian dollar .

Technically speaking, the GBP/AUD daily cycle presents a potential Wolf Wave structure, but the price action structure does not display a clear bearish signal at moment.

(GBP/AUD daily cycle, Ultima Markets MT4)

The Stochastic Oscillator shows no dead cross on the daily cycle. Please be aware of GBP/JPY’s next bullish trend.

(4-hour GBP/AUD cycle, Ultima Markets MT4 )

The 4-hour Elliott Wave structure of GBP/AUD suggests that it may be in a double-saw-tooth rebound phase. After the market confirms the bearish trend, it is possible to pave a sharp downward path.

(1-hour GBP/AUD cycle, Ultima Markets MT4)

On 1-hour cycle of GBP/AUD, a turning point emerged. The exchange rate fell rapidly and was close to the previous breakthrough price. On August 2, the price action formed a potential head-and-shoulders structure. If it falls below the 1.9338 neckline, the probability of going bearish will increase.

(1- hour GBP/AUD cycle, Ultima Markets MT4)

According to the pivot indicator in Ultima Markets MT4 , the central price of the day is 1.94039 ,

Bullish above 1.94039, the first target is 1.94667, and the second is 1.95328.

Bearish below 1.94039, the first target is 1.93373, and the second is 1.92745.

Disclaimer

Comments, news, research, analysis, price, and all information contained in the article only serve as general information for readers and do not suggest any advice. Ultima Markets has taken reasonable measures to provide up-to-date information, but cannot guarantee accuracy, and may modify without notice. Ultima Markets will not be responsible for any loss incurred due to the application of the information provided.