Comprehensive EUR/USD Analysis for October 10, 2023
At Ultima Markets, we are dedicated to providing you with insightful market analysis to help you make informed trading decisions.
In today’s edition, we focus on the EUR/USD currency pair, delving into both fundamental and technical factors that may impact its performance in October 2023.
Key Takeaways
1. Rising U.S. Treasury Yields: The recent surge in long-term U.S. Treasury yields has led to a substantial increase in borrowing costs. This development has garnered attention from influential figures in the financial landscape, including hawkish Logan and Fed Vice Chairman Jefferson.
2. Fed’s Potential Pivot: Acknowledgments from Logan and Jefferson hint at a potential shift in the Federal Reserve’s stance on interest rate hikes. This shift could diverge from previous expectations, impacting the EUR/USD currency pair.
3. Weakness in the U.S. Dollar: Notably, the U.S. dollar index is displaying signs of weakness in the upcoming week. The primary driver behind this trend remains the rising U.S. bond yields.
Fundamentals Impacting EUR/USD
The recent surge in long-term U.S. Treasury yields has substantially increased borrowing costs, reverberating throughout the financial markets. This development has garnered attention from key figures in the financial world, including the hawkish Logan and Fed Vice Chairman Jefferson.
Their acknowledgment of the impact of rising U.S. bond yields on financial conditions suggests a potential shift in the Federal Reserve’s stance on interest rate hikes. As a result, the U.S. dollar index is poised for a potentially weak trend in the coming week.
Technical Analysis
Daily Chart Insights
( Daily chart of EUR/USD, source: Ultima Markets MT4)
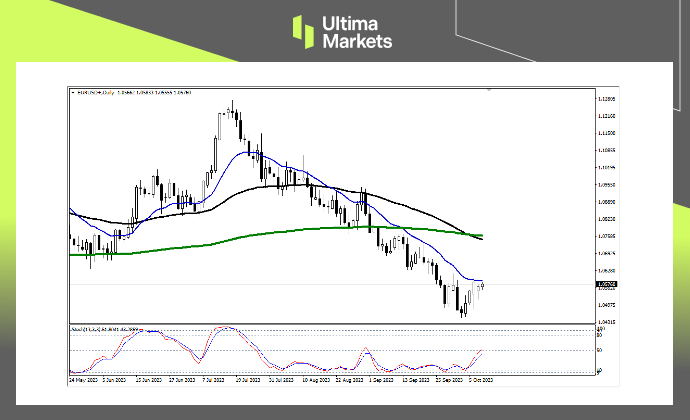
Turning our attention to the daily chart, we observe the stochastic oscillator’s fast line crossing the slow line. However, it’s crucial to note that this indicator is approaching the 50 midline, while the market is in close proximity to the 17-day moving average.
These technical signals suggest the possibility of a market decline today. However, entering long positions should be contingent on a decisive market breakthrough, followed by close monitoring of retracement prices.
4-Hour Chart Analysis
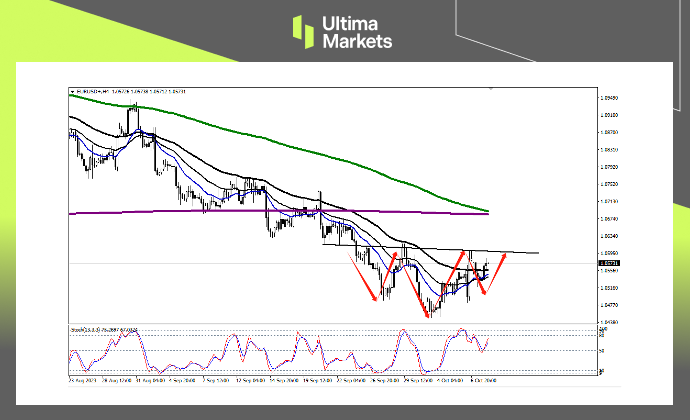
(4-hour chart of EUR/USD, source: Ultima Markets MT4)
On the 4-hour chart, there are indications of a head-and-shoulders bottom formation, though the price has not yet touched the neckline resistance area.
This scenario suggests the potential for a market correction in the near future.
1-Hour Chart Insights
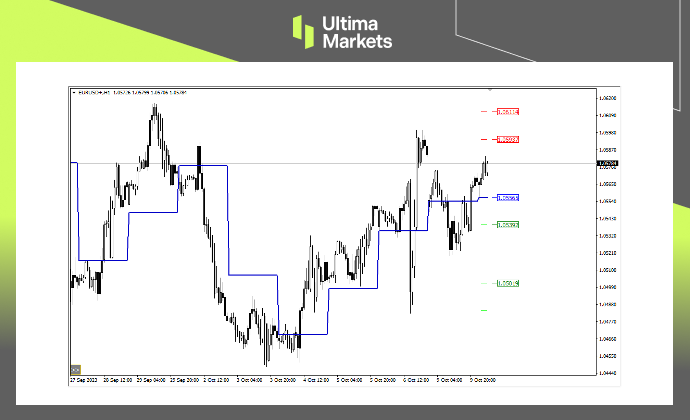
(1-hour chart of EUR/USD, source: Ultima Markets MT4)
Referencing the 1-hour chart, Ultima Markets’ pivot indicator designates the central price of the day as 1.05565. To navigate these levels effectively:
Bullish sentiment prevails above 1.05565, with the first target at 1.05937 and the second target at 1.06114.
On the other hand, a bearish stance should be taken below 1.05565, targeting 1.05392 as the first level and 1.05019 as the second.
Conclusion
In summary, the EUR/USD market in October 2023 is subject to a dynamic interplay of fundamental and technical factors.
Rising U.S. Treasury yields and the potential shift in the Federal Reserve’s stance are fundamental drivers, while technical indicators suggest the possibility of a market decline and the formation of a head-and-shoulders pattern.
Traders and investors are advised to exercise vigilance and closely monitor these developments, considering both fundamental and technical aspects.
Staying well-informed and adapting strategies accordingly is crucial for navigating the ever-evolving landscape of currency trading effectively.
For personalized investment guidance, consult our team of experts at Ultima Markets.
Disclaimer
Comments, news, research, analysis, prices and other information contained in this article can only be regarded as general market information, provided only to help readers understand the market situation, and do not constitute investment advice. Ultima Markets will not be responsible for any loss or loss (including but not limited to any loss of profits) that may arise from the direct or indirect use or reliance on such information.
Written on October 10, 2023 at 11:45 am, by mervin
Comments Off on Focus on EUR/USD Today – 10th October 2023
In this comprehensive analysis, Ultima Markets brings you an insightful breakdown of the USDX for 6th October 2023.
The Core: Fundamental Factors
ADP Employment Data: Recent ADP employment data showed a significant drop below expectations. This is a crucial indicator of labor market dynamics.
Historically Low Jobless Claims: The announcement of 207,000 initial jobless claims last week, still at a historical low, underscores the robustness of the job market.
Fewest Quarterly Layoffs: U.S. companies have reported the fewest quarterly layoffs in a year due to strong seasonal hiring plans. This is a significant positive signal for the economy.
The Turning Point: Interest Rates
The above factors collectively raise questions about the possibility of interest rate adjustments in the near future. The final decision hinges on the impending release of US non-farm employment data, due tonight. This data will be pivotal in shaping the USDX’s trajectory.
The Technical Aspect: USDX Trends
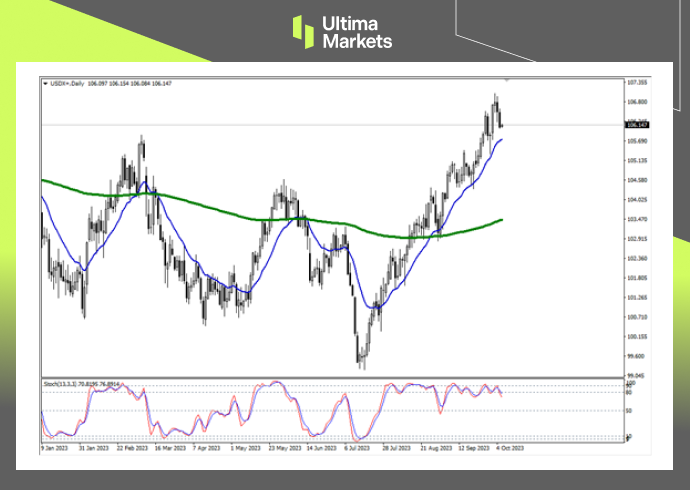
Daily Chart Trends: On the daily chart, the US dollar index has experienced a two-day decline. The stochastic oscillator’s dead cross in the overbought area suggests a short-term downtrend.
Bearish Trend: To confirm a bear trend, it’s crucial for the USDX to break effectively below its recent lows. The initial target rests near the blue 17-day moving average.
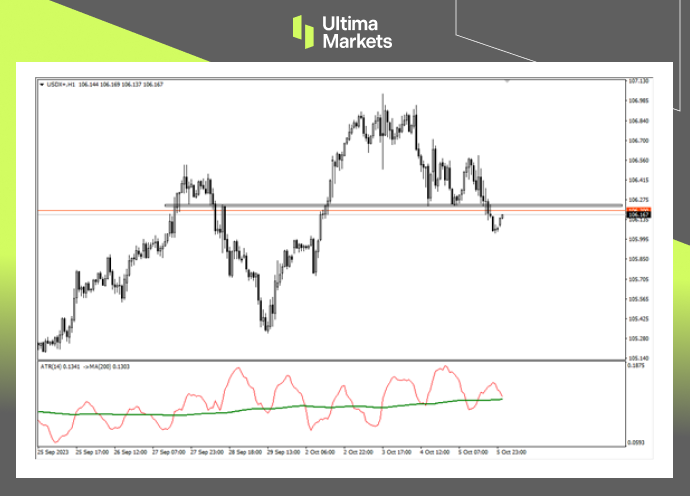
Hourly Chart Insights: On the hourly chart, the market has breached the support level around 106.23. The ATR combination indicator confirms this breakdown.
Pivot Indicator: As per Ultima Markets’ pivot indicator, the central price for the day is 106.200.
Daily chart of USDX
(Daily chart of USDX, source: Ultima Markets MT4)
1-hour chart of USDX
Although it has increased the probability of a bear trend, it still needs to wait for the U.S. dollar index to effectively fall below the lowest price. The price may be relatively limited. The first target is near the blue 17-day moving average.
(1-hour chart of USDX, source: Ultima Markets MT4)
Pivot Indicators
On the 1-hour chart, the market fell below the support level around 106.23, and the ATR combination indicator hinted at the effectiveness of the breakdown. Waiting for the price to retreat and see if there is any chance of further downward movement.
(Pivot Indicators for USDX, source: Ultima Markets MT4)
Potential Scenarios
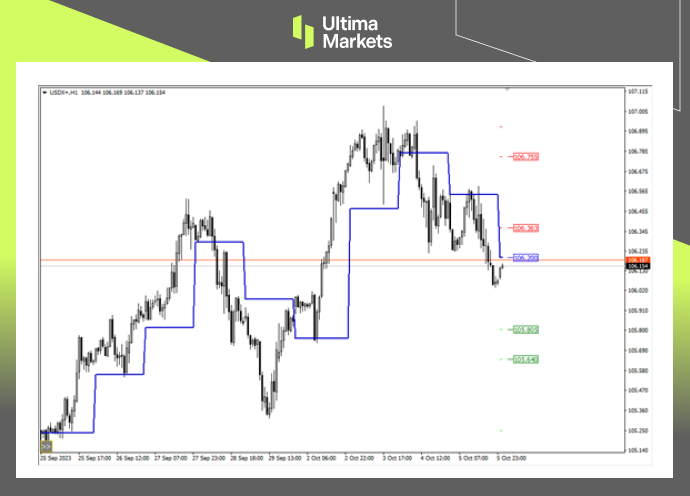
According to the pivot indicator in Ultima Markets MT4, the central price of the day is 106.200.
Bullish Above 106.200: If the USDX remains above 106.200, the first target is 106.363, with a secondary target at 106.755.
Bearish Below 106.200: In case the USDX dips below 106.200, the initial target is 105.805, with a secondary target at 105.640.
Legal Documents
Ultima Markets, a trading name of Ultima Markets Ltd, is authorized and regulated by the Financial Services Commission “FSC” of Mauritius as an Investment Dealer (Full-Service Dealer, excluding Underwriting) (license No. GB 23201593). The registered office address: 2nd Floor, The Catalyst, 40 Silicon Avenue, Ebene Cybercity, 72201, Mauritius.
Disclaimer
Comments, news, research, analysis, price, and all information contained in the article only serve as general information for readers and do not suggest any advice. Ultima Markets has taken reasonable measures to provide up-to-date information, but cannot guarantee accuracy, and may modify without notice. Ultima Markets will not be responsible for any loss incurred due to the application of the information provided.
Comprehensive USD/CAD Analysis For October 5, 2023
In this comprehensive analysis, Ultima Markets brings you an insightful breakdown of the USD/CAD for 5th October 2023.
Key Takeaways
U.S. Economic Data: The release of subpar U.S. economic data acted as a catalyst for market movements. This data sent shockwaves through the forex market, causing traders to react by selling off the U.S. dollar.
Crude Oil Market: Another significant factor was the impending destruction of crude oil demand. This development, coupled with the gloomy macroeconomic outlook, played a substantial role in shaping the forex landscape. As crude oil prices began to fall, the depreciation of currencies in energy-exporting countries gained momentum.
Canadian Dollar’s Depreciation: The Canadian dollar, in particular, saw a short-term depreciation trend that intensified due to the interplay of these factors.
USD/CADTechnical Analysis
USD/CAD Weekly Chart
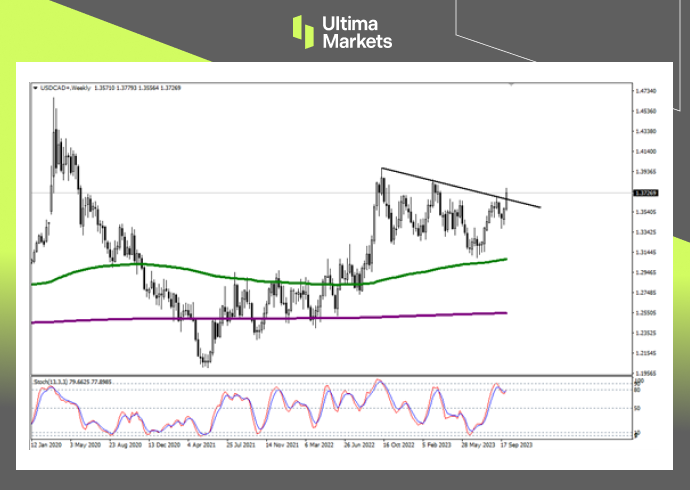
The weekly chart of USD/CAD in October 2023 revealed a pivotal development. The closing line for the week was on the verge of breaking through the suppression of the downward trend line, which had been in place since October of the previous year. Furthermore, the stochastic oscillator was on the cusp of reaffirming the upward trend.
(Weekly chart of USD/CAD, source: Ultima Markets MT4)
USD/CAD 4-Hour Chart Analysis
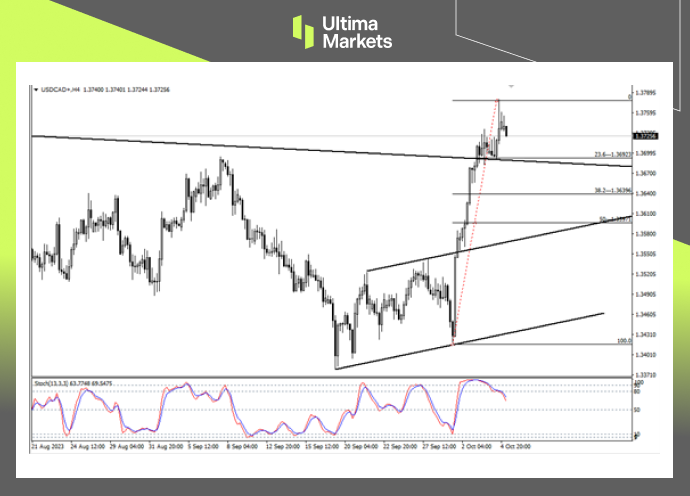
Zooming in on the 4-hour chart, we identified a weakening of prices following the recent breach of the weekly downward trend line. The stochastic oscillator displayed a divergent downward trend, indicating that the exchange rate was likely entering an adjustment cycle.
(4-hour chart of USD/CAD, source: Ultima Markets MT4)
USD/CAD 1-Hour Chart Insights
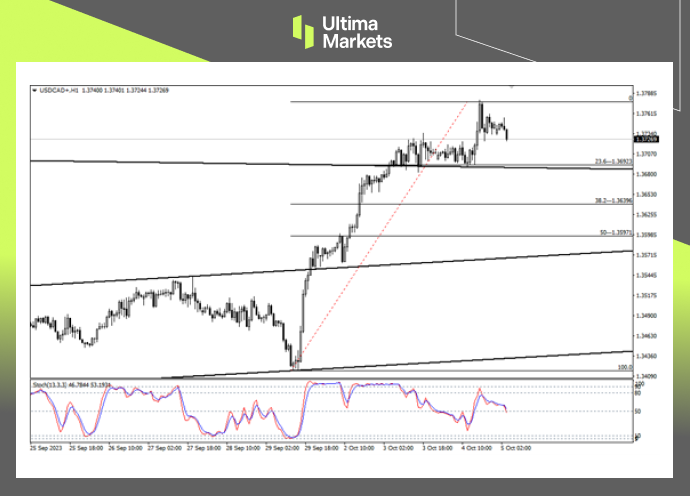
On the 1-hour chart, the 23.6% retracement level at 1.36923 emerged as an extremely critical support price. This level could potentially mark the end of the downward trend. Conversely, falling below this level would signify a breach of the weekly downward trend line, casting doubts on the legitimacy of the recent upward trend.
(1-hour chart of USD/CAD, source: Ultima Markets MT4)
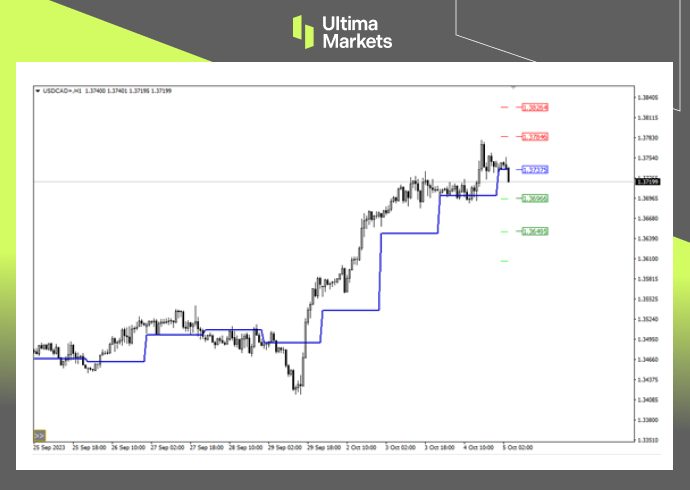
USD/CAD Pivot Indicator
(1-hour chart of USD/CAD, source: Ultima Markets MT4)
According to the pivot indicator in Ultima Markets MT4, the central price of the day was 1.37375.
Bullish above 1.37375, the first target is 1.37846, the second target is 1.38264
Bearish below 1.37375, first target 1.36966, second target 1.36495
Conclusion
In conclusion, October 2023 brought about a series of significant fundamental and technical developments in the USD/CAD forex market. Traders were faced with key decision points, influenced by a variety of factors, from U.S. economic data to crude oil prices.
The forex market remains inherently volatile, emphasizing the importance of informed, strategic, and responsive trading decisions.
At Ultima Markets, we are committed to providing valuable market insights to empower your trading decisions.
While this article offers a comprehensive overview of the USD/CAD situation in October 2023, it’s essential to keep a watchful eye on market developments and continue refining your trading strategies to stay ahead in the competitive world of forex trading.
Legal Documents
Ultima Markets, a trading name of Ultima Markets Ltd, is authorized and regulated by the Financial Services Commission “FSC” of Mauritius as an Investment Dealer (Full-Service Dealer, excluding Underwriting) (license No. GB 23201593). The registered office address: 2nd Floor, The Catalyst, 40 Silicon Avenue, Ebene Cybercity, 72201, Mauritius.
Disclaimer
Comments, news, research, analysis, price, and all information contained in the article only serve as general information for readers and do not suggest any advice. Ultima Markets has taken reasonable measures to provide up-to-date information, but cannot guarantee accuracy, and may modify without notice. Ultima Markets will not be responsible for any loss incurred due to the application of the information provided.
Technical Analysis: A Closer Look on GBP/NZD Trading Charts
GBP/NZD Daily Chart Insights
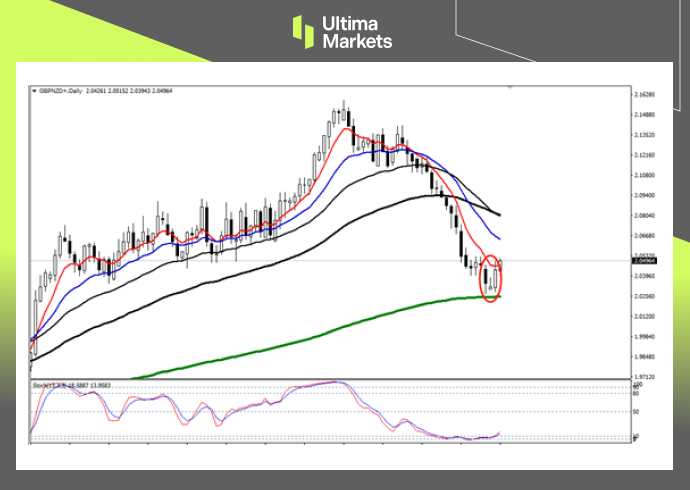
Reversal Structure: The daily chart illustrates a clear reversal structure, with the 240-day moving average acting as a significant resistance point.
( Daily chart of GBP/NZD, source: Ultima Markets MT4)
The stochastic oscillator technical indicator has also left the oversold area after being oversold for nearly 9 trading days. The market may continue to rebound and rise today.
GBP/NZD 4-Hour Chart Observations
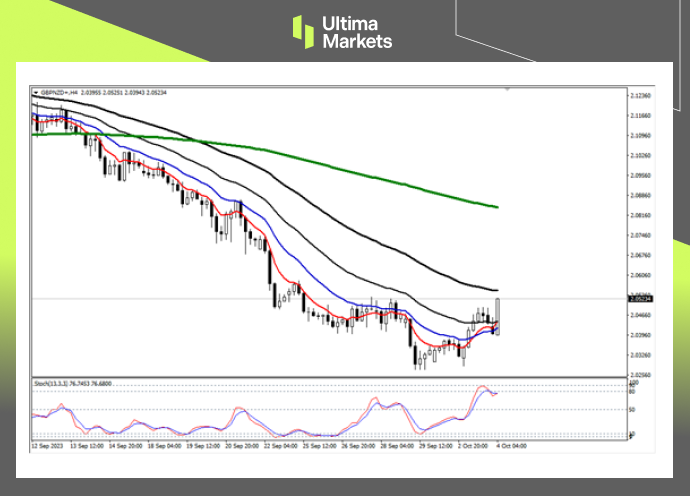
Motive Wave: A five-wave upward structure has emerged since the end of September, signaling a potential motive wave.
Moving Average Test: The market has surged rapidly and is nearing the 65-period moving average, a level to monitor for potential breakout.
(4-hour chart of GBP/NZD, source: Ultima Markets MT4)
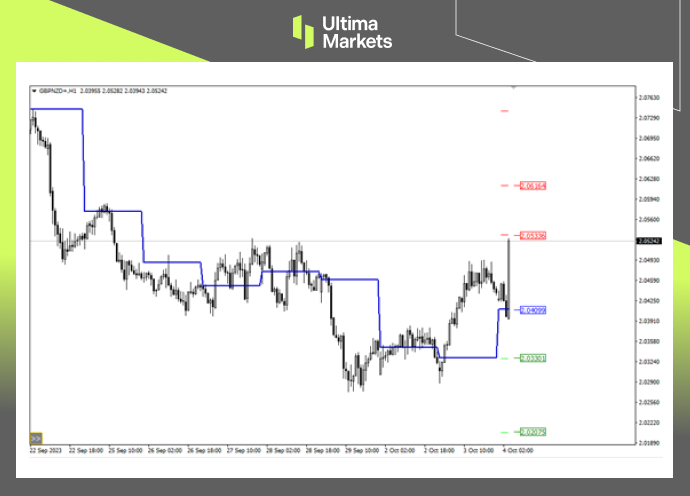
Pivot Indicator
(1-hour chart of GBP/NZD, source: Ultima Markets MT4)
Bullish Outlook: A price movement above 2.04099 could trigger an upward momentum, targeting 2.05336 as the first level of resistance and 2.06164 as the second.
Bearish Outlook: A dip below 2.04099 may indicate a bearish trend, with the first support level at 2.03301 and the second at 2.02075.
Legal Documents
Ultima Markets, a trading name of Ultima Markets Ltd, is authorized and regulated by the Financial Services Commission “FSC” of Mauritius as an Investment Dealer (Full-Service Dealer, excluding Underwriting) (license No. GB 23201593). The registered office address: 2nd Floor, The Catalyst, 40 Silicon Avenue, Ebene Cybercity, 72201, Mauritius.
Disclaimer
Comments, news, research, analysis, price, and all information contained in the article only serve as general information for readers and do not suggest any advice. Ultima Markets has taken reasonable measures to provide up-to-date information, but cannot guarantee accuracy, and may modify without notice. Ultima Markets will not be responsible for any loss incurred due to the application of the information provided.
Comprehensive Brent Oil Analysis for October 3, 2023
In this comprehensive analysis, Ultima Markets brings you an insightful breakdown of the Brent Oil (UKOUSD) for 3rd October 2023.
Key Takeaways
Key Point: The lifting of the U.S. government shutdown crisis, coupled with robust PMI data, has driven the U.S. dollar index to 107, a level not seen since November last year. This surge in the dollar’s strength has led to a sharp decline in non-U.S. currencies and a corresponding dip in crude oil prices, reaching three-week lows.
Increased OPEC Production: Notably, OPEC’s oil production increased by 120,000 barrels per day in September compared to August, reaching 27.73 million barrels per day for the second consecutive month.
Bearish Sentiment Emerges: Concerns over increased supply and the impact of high interest rates on demand have prompted bearish sentiment in the crude oil market.
Brent Oil Technical Analysis
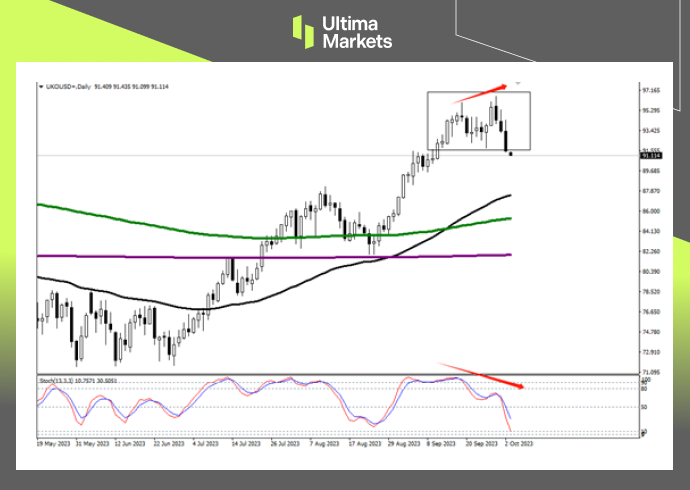
Brent Oil Daily Chart Analysis
( Daily chart of BRENT OIL, source: Ultima Markets MT4)
Key Point: The daily chart reveals a rapid decline in crude oil prices, signaling a strong bearish trend.
Stochastic Oscillator Signals
Key Point: Stochastic oscillator technical indicators suggest a divergence from market prices, indicating a high probability of short-term bearishness.
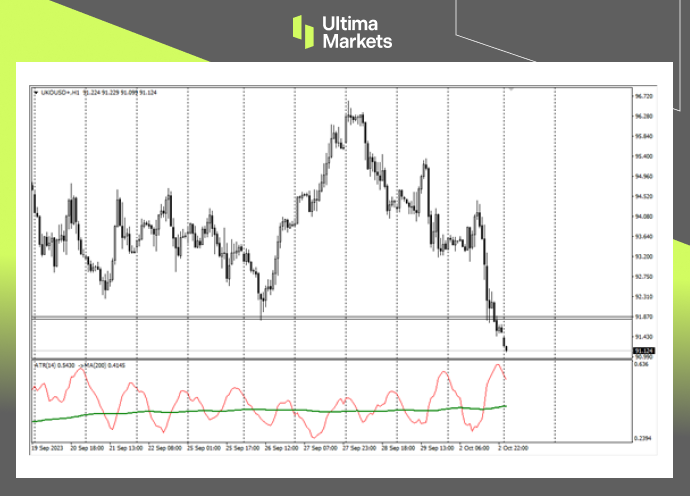
Brent Oil 1 Hour Chart Analysis
(1hour chart of BRENT OIL, source: Ultima Markets MT4)
Key Point: Recent significant volatility is observed on the 1-hour chart, with the ATR combination indicator signaling an effective breakthrough. Traders should exercise caution and monitor entry opportunities.
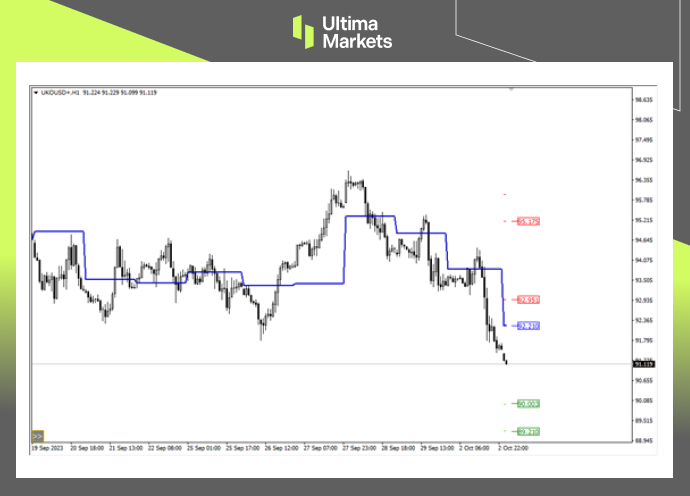
Pivot Indicator
(1-hour chart of BRENT OIL, source: Ultima Markets MT4)
Key Point: According to the pivot indicator in Ultima Markets’ MT4 platform, the central price of the day stands at 92.210. Technical outlook:
Bullish Scenario: Above 92.210, with targets set at 92.951 and 95.175.
Bearish Scenario: Below 92.210, with targets at 90.003 and 89.210.
Legal Documents
Ultima Markets, a trading name of Ultima Markets Ltd, is authorized and regulated by the Financial Services Commission “FSC” of Mauritius as an Investment Dealer (Full-Service Dealer, excluding Underwriting) (license No. GB 23201593). The registered office address: 2nd Floor, The Catalyst, 40 Silicon Avenue, Ebene Cybercity, 72201, Mauritius.
Disclaimer
Comments, news, research, analysis, price, and all information contained in the article only serve as general information for readers and do not suggest any advice. Ultima Markets has taken reasonable measures to provide up-to-date information, but cannot guarantee accuracy, and may modify without notice. Ultima Markets will not be responsible for any loss incurred due to the application of the information provided.
Comprehensive AUD/USD Analysis for September 28, 2023
In this comprehensive analysis, Ultima Markets brings you an insightful breakdown of AUD/USD for 28th September 2023.
Key Takeaways
Australian Inflation: Australian inflation reached a notable 5.2% in September 2023, in line with market expectations. This marked a significant uptick since June and is primarily attributed to the depreciation of the Australian dollar and rising oil prices.
Market Perception: The market’s consensus was that these inflationary pressures, while substantial, would not be adequate to persuade the RBA to pursue an interest rate hike strategy. As a result, the initial reaction in the currency markets was mixed. The Australian dollar experienced a short-lived appreciation, but the prevailing sentiment soon led to a decline.
Short-Term vs. Long-Term Impact
Short-Term Outlook: The short-term Australian data had a limited impact on the currency pair. Market attention swiftly shifted to the United States, with a specific focus on the core PCE data. Should this data continue to show an upward trend, it could maintain the possibility of interest rate hikes during the year, consequently bolstering the US dollar.
Budgetary Concerns: However, the situation in the United States presents a significant variable. The fiscal year for 2023 is concluding, and if political parties fail to reach an agreement on the budget, the risk of a government shutdown looms large. In such an event, the market may seize the opportunity to speculate on a weakening US dollar.
Technical Analysis
AUD/USD Daily Chart Analysis
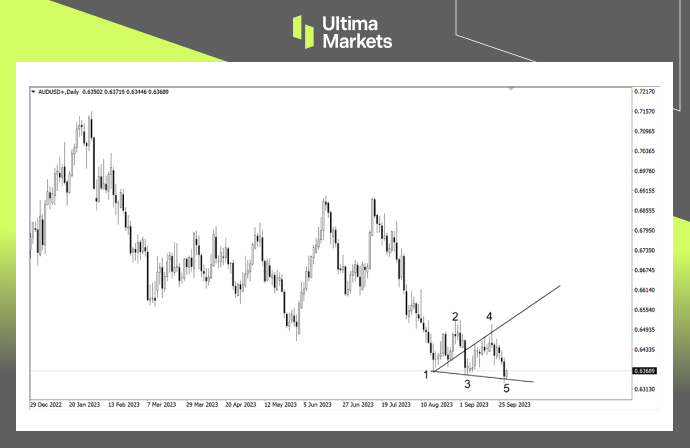
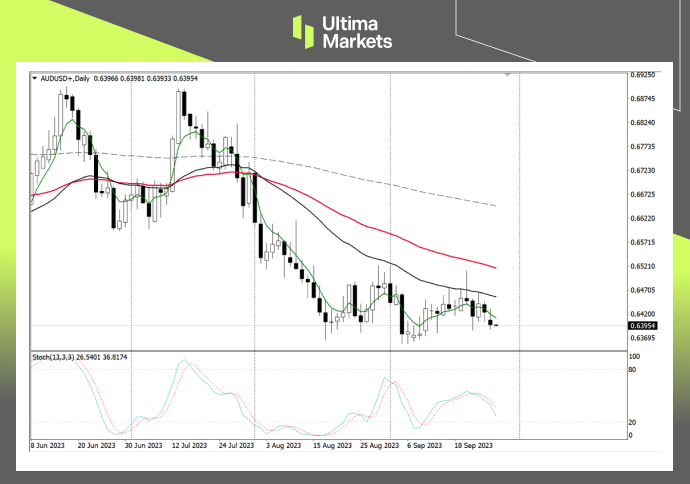
(Daily chart of AUD/USD, source: Ultima Markets MT4)
Significant Decline: The daily chart indicated an expected decline in the exchange rate following the inflation data release. Subsequently, the market exhibited a distinctive Wolfe wave pattern, which carries the potential for a substantial rebound. It’s important to note that this pattern does not signify a definitive trend reversal at this stage.
AUD/USD 4-Hour Chart Analysis
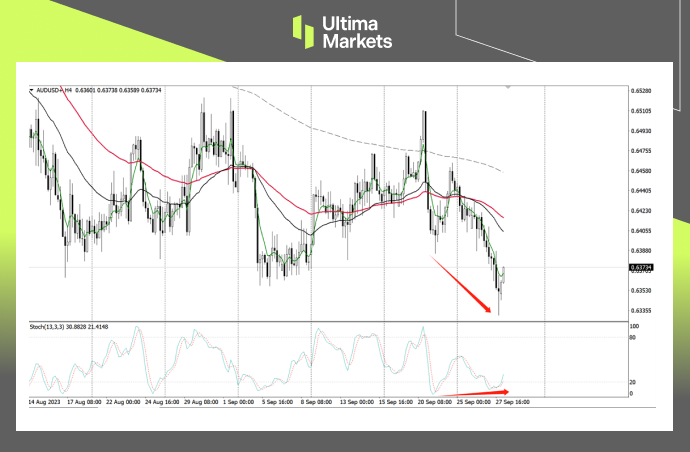
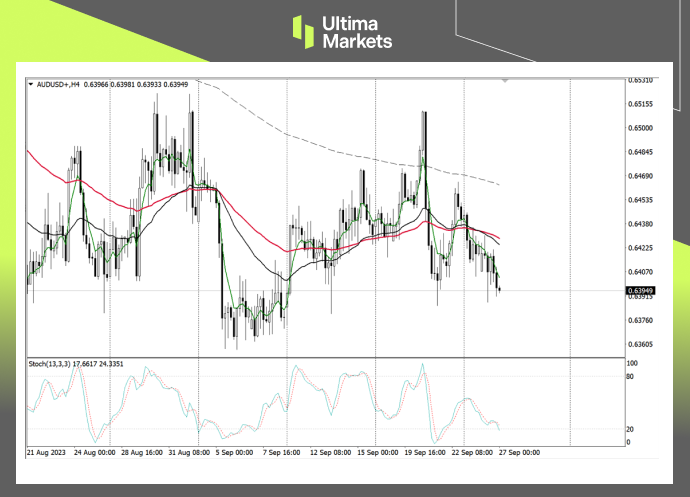
(4-hour chart of AUD/USD, source: Ultima Markets MT4)
Divergence Structure: Transitioning to the 4-hour chart, the price decline led to the formation of a stochastic divergence pattern. This suggests that sellers may find motivation to close their positions and exit at the support level. Observing the influence of the 33-period moving average is crucial.
AUD/USD 1-Hour Chart Analysis
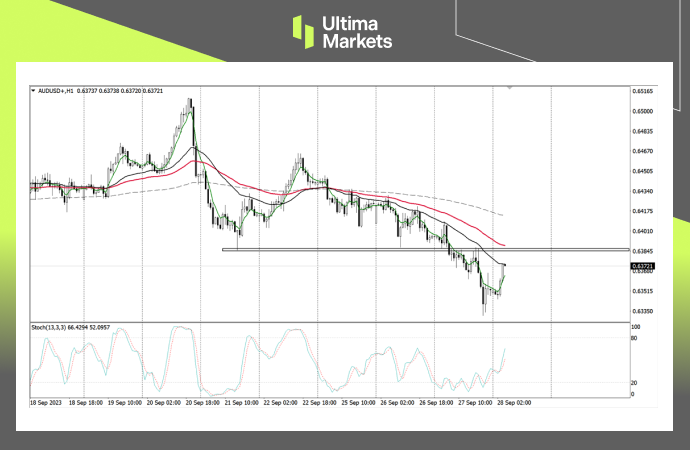
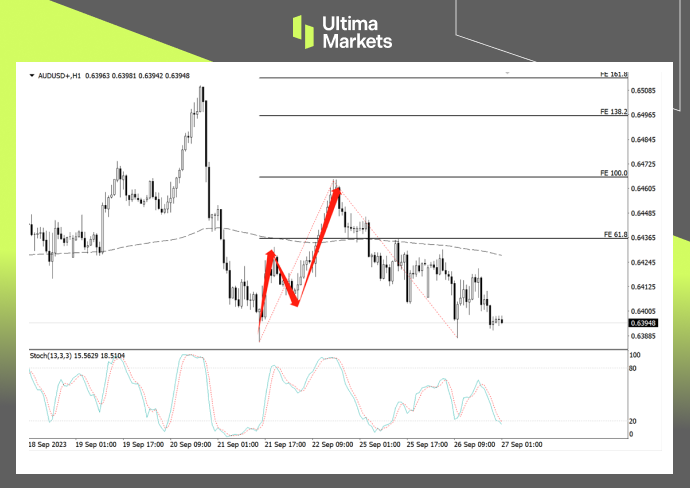
(1-hour chart of AUD/USD, source: Ultima Markets MT4)
Critical Zone: Within the 1-hour timeframe, the area around 0.63853 is a crucial support and resistance conversion zone. This level is also proximate to the 65-period moving average. A potential breakout above this resistance level may pose challenges for the Australian dollar in maintaining its downward trajectory for the day.
Pivot Indicator
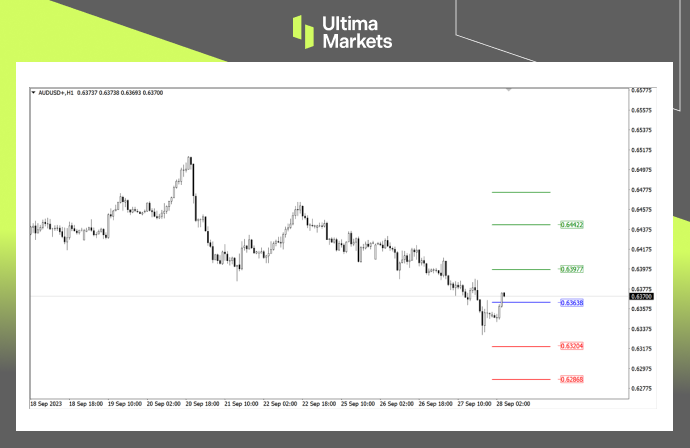
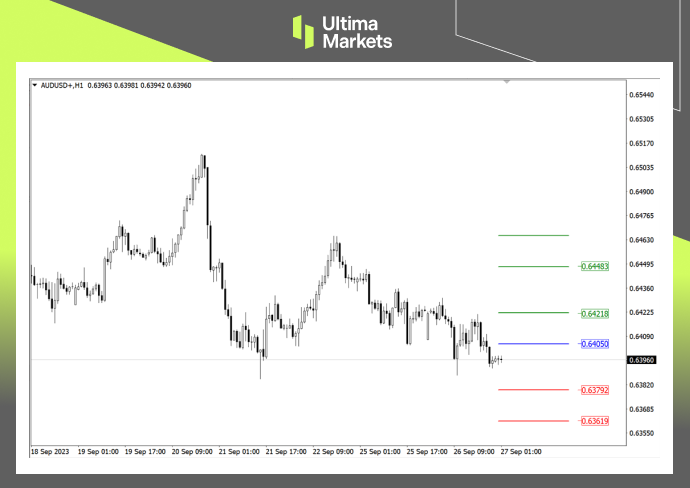
(1-hour chart of AUD/USD, source: Ultima Markets MT4)
In bullish scenarios above this level, the first target is 0.63977, and the second target extends to 0.64422.
In bearish scenarios below 0.63638, the first target is 0.63204, with the second target at 0.62868.
Legal Documents
Ultima Markets, a trading name of Ultima Markets Ltd, is authorized and regulated by the Financial Services Commission “FSC” of Mauritius as an Investment Dealer (Full-Service Dealer, excluding Underwriting) (license No. GB 23201593). The registered office address: 2nd Floor, The Catalyst, 40 Silicon Avenue, Ebene Cybercity, 72201, Mauritius.
Disclaimer
Comments, news, research, analysis, price, and all information contained in the article only serve as general information for readers and do not suggest any advice. Ultima Markets has taken reasonable measures to provide up-to-date information, but cannot guarantee accuracy, and may modify without notice. Ultima Markets will not be responsible for any loss incurred due to the application of the information provided.
Comprehensive AUD/USD Analysis for September 27, 2023
In this comprehensive analysis, Ultima Markets brings you an insightful breakdown of the AUD/USD for 27th September 2023.
Key Takeaways
Fundamentally, our analysis centers on the forthcoming release of Australia’s August CPI data and its potential repercussions for the AUD/USD market. Key takeaways include:
Inflation Expectations: Market consensus points to a potential inflation rise from 4.9% in July to 5.2% in August, fueling discussions on impending interest rate hikes.
Drivers of Inflation: The depreciation of the Australian dollar and escalating oil prices are identified as the driving forces behind the expected inflation surge.
RBA’s Dilemma: The Reserve Bank of Australia (RBA) faces the pivotal decision of whether to implement interest rate hikes, with market expectations influencing their stance.
Market Reaction: Anticipate a post-data release rebound in the Australian dollar, though the sustainability of this uptrend remains uncertain.
AUD/USD Technical Analysis
AUD/USD Daily Chart Analysis
( Daily chart of AUD/USD, source: Ultima Markets MT4)
On the daily chart, the U.S. dollar index has exhibited a notable upward trajectory. Key technical observations include:
Breakthrough: The U.S. dollar index has closed above the upper boundary of its consolidation range.
Stochastic Oscillator: An upward cross on the stochastic oscillator underscores the bullish trend in the U.S. dollar index.
AUD/USD 4-hour Chart Observations
(4-hour chart of AUD/USD, source: Ultima Markets MT4)
Shifting focus to the 4-hour chart, we identify essential technical aspects that inform market dynamics:
Previous High Breakthrough: Following a 12-day consolidation phase after the U.S. dollar index surpassed its previous high on September 5, it has continued its upward course.
1-hour Chart and ATR Combination Indicator
(1-hour chart of AUD/USD, source: Ultima Markets MT4)
The 1-hour chart and the ATR combination indicator offer granular insights into the market:
Breakthrough Effectiveness: The ATR combination indicator supports the effectiveness of the U.S. dollar index breakthrough.
Potential Retracement: During the Asian session, a retracement is anticipated, necessitating patience from traders. The initial target is set at 105.443.
Pivot Indicator Analysis
(1-hour chart of AUD/USD, source: Ultima Markets MT4)
While September saw a halt in interest rate hikes, the dot plot projections signal a potential resurgence in rate increases later in the year.
This is underpinned by a forthcoming, more hawkish monetary policy in the next year, with a notable reduction in the number of projected interest rate cuts.
USDX Technical Analysis
USDX Daily Chart Insights
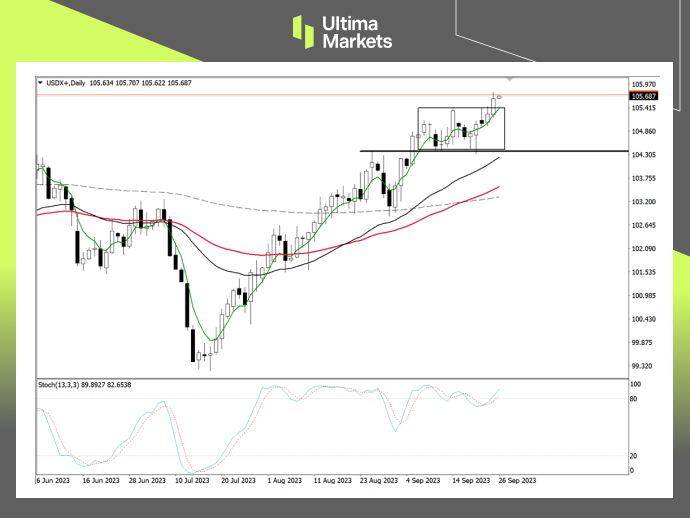
( Daily chart of USDX, source: Ultima Markets MT4)
Turning our focus to the technical landscape, the USDX exhibits compelling upward momentum.
The daily chart reveals a breakthrough as the US Dollar Index’s price closes above its consolidation range’s upper boundary.
Moreover, the stochastic oscillator, a pivotal technical indicator, has signaled a bullish trajectory.
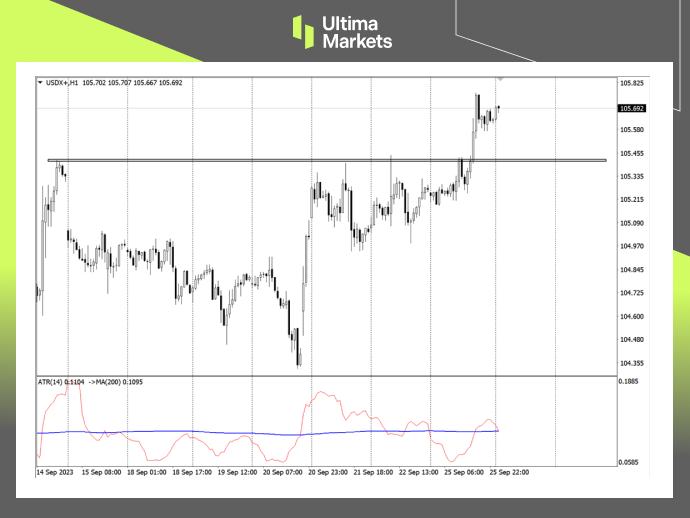
USDX 1-Hour Chart Analysis
(1-hour chart of USDX, source: Ultima Markets MT4)
The one-hour chart presents a more granular picture, with the ATR combination indicator affirming the effectiveness of the recent breakthrough.
Although retracement is conceivable during the Asian trading session, a market rebound is anticipated. The initial target is fixed at the support price of 105.443.
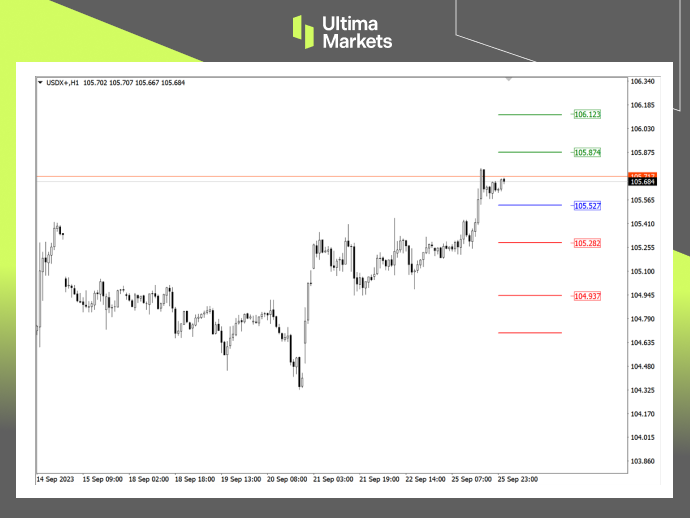
Ultima Markets Pivot Indicator
(1-hour chart of USDX, source: Ultima Markets MT4)
Ultima Market’s MT4 pivot indicator designates the day’s central price at 105.527. For investors and traders, here are the essential projections:
Bullish Scenario:
Bullish above 105.527
First target: 105.874
Second target: 106.123
Bearish Scenario:
Bearish below 105.527
First target: 105.282
Second target: 104.937
These projections, though subject to market dynamics and emerging data, provide a compass for navigating the ever-evolving terrain of financial markets.
Conclusion
Written on September 26, 2023 at 11:30 am, by mervin
Comments Off on Focus on USDX Today – 26th Sep 2023
Comprehensive USD/CNH Analysis for September 22, 2023
In this comprehensive analysis, Ultima Markets brings you an insightful breakdown of the USD/CNH for 22nd September 2023.
Key Takeaways
The Federal Reserve’s Decision: In September, the Federal Reserve made a pivotal decision to halt interest rate hikes. The dot plot hints at the possibility of future rate increases.
Furthermore, the overall monetary policy for the upcoming year leans towards a more hawkish stance, with a shift from an anticipated 5 interest rate cuts to just 2.
These factors collectively maintain the US dollar’s dominance, momentarily placing non-US currencies at a disadvantage.
USD/CNH Technical Analysis
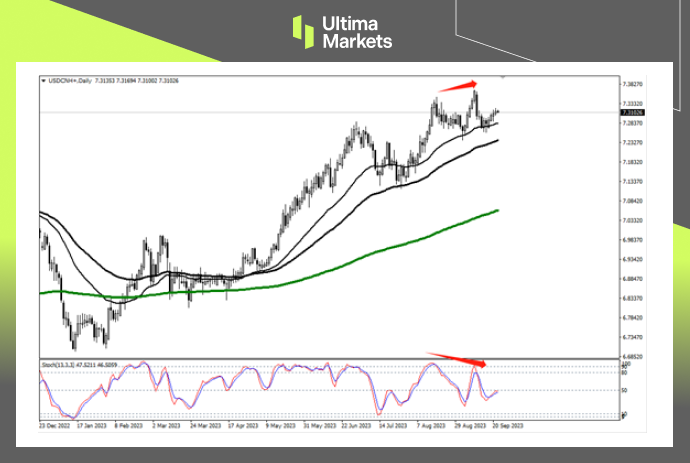
USD/CNH Daily Chart Signals
(Daily chart of USD/CNH, source: Ultima Markets MT4)
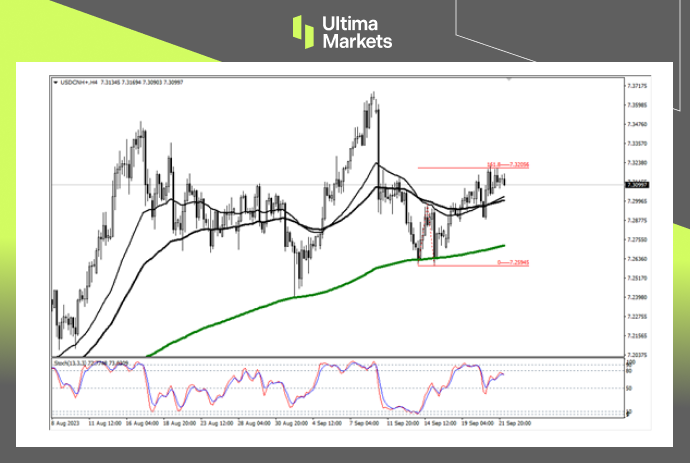
Rebound and Candle Pattern: Our analysis of the daily chart reveals an interesting rebound in the USD/CNH pair after reaching the 33-day moving average.
This rebound pattern closely resembles a head and shoulders candle formation. This chart development signifies a potential right shoulder formation.
USD/CNH 4-Hour Chart Dynamics
(4-hour chart of USD/CNH, source: Ultima Markets MT4)
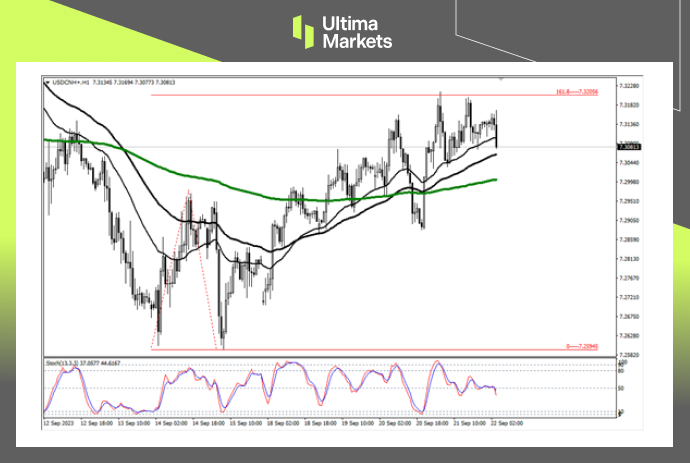
Rebound Magnitude: Transitioning to the 4-hour chart, we observe that the recent rebound of USD/CNH has reached a significant level, approximately 1.618 times the rebound height recorded on September 14.
It is vital to keep a close watch on market movement below the 65-period moving average to gain insights into the conclusion of the market rebound.
Insights from the 1-Hour Chart
(1-hour chart of USD/CNH, source: Ultima Markets MT4)
Equilibrium in the Market: On the 1-hour chart, the moving average remains a pivotal support for the market.
The stochastic oscillator hovers around the middle area at 50, indicating an equilibrium between bullish and bearish sentiments.
To confirm the initiation of short positions, a market movement below the moving average group is crucial.
Ultima Markets Pivot Indicator
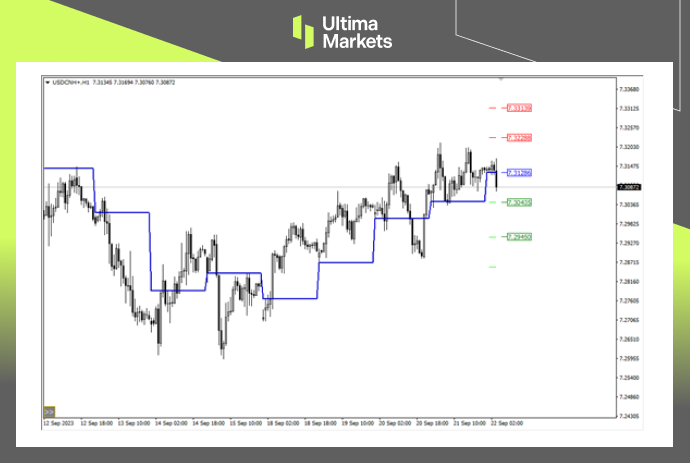
(1-hour chart of USD/CNH, source: Ultima Markets MT4)
Key Price Level: According to the pivot indicator in Ultima Markets MT4, the central price for the day stands at 7.31286.
A bullish sentiment prevails above this level, with the first target at 7.32288 and the second target at 7.33139.
Conversely, a bearish stance is favored below 7.31286, with the first target at 7.30435 and the second target at 7.29450.
Conclusion
Written on September 22, 2023 at 11:22 am, by mervin
Comments Off on Focus On USD/CNH Today – 22nd Sep 2023
For investors investing in China’s A-shares, the performance of China’s stock market so far this year has only been slightly impressive at the beginning of the year. However, as China’s economic recovery gradually falls short of expectations, and the exchange rate of CNY/USD continues to fall, the performance of A-shares has also declined. Although there are frequent rumors in the market that China will launch large-scale stimulus, it turns out there is always loud thunder but little rain.
On August 27, the China Securities Regulatory Commission finally introduced a series of favorable policies such as halving stamp. However, at the opening of the next day, the three major A-share stock indexes only rose for a short period of about 1 minute, then fell back one after another. As a result, many Chinese netizens commented: “I’m optimistic about the fate of the country but choose to bet on the Nasdaq.”
In today’s turbulent international political and economic situation, can China’s A-shares break out of the siege and turn the tide? This article will take you to find out.
Why the large stimulus isn’t coming?
In addition to the need to wait for the RMB exchange rate to strengthen, whether China can introduce large-scale stimulus measures is also an important factor in the strength of the A-shares market. However, it seems that China is quite conservative about the introduction of stimulus measures. Not only is the intensity of the stimulus measures currently introduced not large, but the speed of introduction is as fast as squeezing out toothpaste, and China has not shown that it plans to launch large-scale stimulus.
On September 15, the People’s Bank of China decided to lower the deposit reserve ratio of financial institutions by 0.25 percentage points for the second time this year. Although it lowered the required reserve ratio, it did not lower interest rates. Therefore, the market reaction was also calm. In the end, the Shanghai Composite Index even closed down 0.28% that day. It can be seen that the so-called rescue efforts obviously did not meet market expectations.
So here comes the question. Since the market now knows that large-scale stimulus will likely solve the current predicament of A-shares, why is there still no such stimulus?
Just in mid-August, Ray Dalio, the founder of Bridgewater Associates, the world’s largest hedge fund, publicly stated that China is in urgent need of reducing leverage. His remarks may explain why China has been slow to introduce large stimulus policies. As we all know, debt is a double-edged sword. When maintained at the right level, it can provide upward momentum for national economic growth. However, once the critical threshold is exceeded, debt will undoubtedly have a negative impact on the economy.
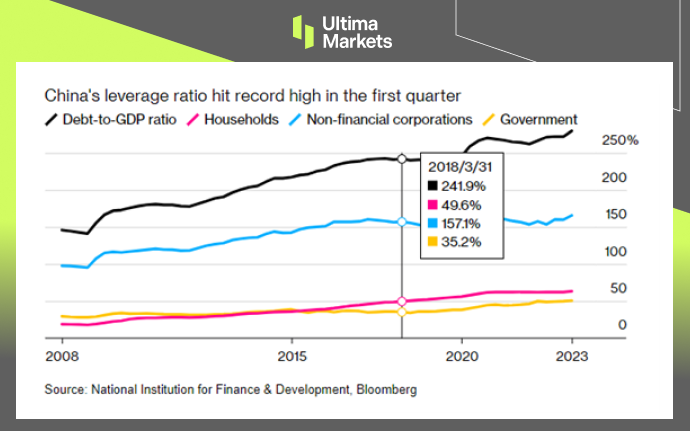
In fact, as early as a few years ago, China had begun to continuously publicize that it would embark on a “road to deleveraging.” In 2018, China’s macro leverage ratio was about 240%. However, in recent years, with the outbreak of the epidemic and changes in the economic situation, the leverage ratio has not only not declined, but has risen to about 280%. Therefore, although large-scale stimulus policies are almost the only prescription to boost China’s stock market in the short term, China will obviously remain cautious about stimulus policies under the urgent need to reduce leverage.
China’s leverage ratio has remained high for several years.
Can A-shares get better in the future?
Since it is difficult to implement stimulus measures on a large scale at the moment, does this mean that A-shares are hopeless? Whenever this happens, you will definitely hear some so-called stock commentators say: “Although A-shares are under pressure in the short term, their long-term fundamentals are good.” In our opinion, such similar remarks are probably just half true. Although A-shares are under pressure in the short term, their long-term fundamentals may not be completely positive.
Why? To answer this question, we must start with the composition of A-shares.
If we talk about the market capitalization leaders or star stocks in A-shares, investors may first think of consumer or financial banking stocks such as Kweichow Moutai, Ping An, and Industrial and Commercial Bank of China. Correspondingly, when talking about the leading stars of the US stock market, Apple, Tesla, Nvidia, Amazon, etc. may come to mind, but these companies basically belong to the technology industry.
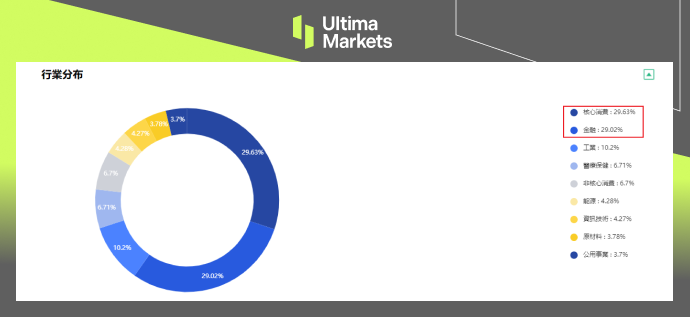
In fact, this stereotype aligns with the current status of the A-share and US stock markets. Let’s take the FTSE China A50 Index (composed of the top 50 A-share stocks by market capitalization) as an example. The figure below shows that among the top 50 stocks by market capitalization, the financial industry accounts for 28.25%, and the core consumer industry accounts for 30.77%. These two major industries undoubtedly occupy the majority.
Breakdown of industries in FTSE A50 Index
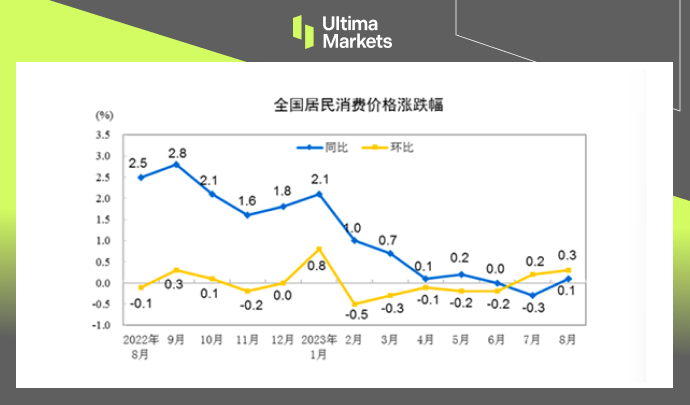
But the problem lies precisely with these two industries. The first is the consumer industry. Since China has continued to show a “consumption downturn” this year, the consumer industry will naturally bear the brunt of the impact. This can also be reflected in the rise and fall of CPI (Consumer Price Index). As can be seen from the chart below, since entering 2023, China’s CPI trend, if not a recessionary trend, has at least shown a sideways trend. And this is naturally not good news for the core consumer industry. Consumption needs a trend toward inflation to realize that consumer prices can rise, allowing relevant companies to reap higher profits. But once the consumption level falls into a sideways situation, the relevant company’s growth expectations will naturally be greatly restricted.
Rise and fall of China’s CPI in the past year.
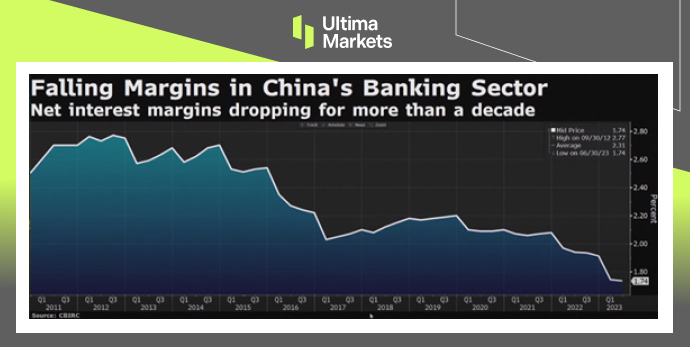
Then, let’s talk about the financial industry. Financial stocks in China’s A-share market are actually mainly banking stocks such as China Merchants Bank, Industrial and Commercial Bank of China, and Agricultural Bank of China. In the current economic environment in China, the growth expectations of bank stocks are subject to a key factor, which is net interest margin. The so-called net interest margin refers to the ratio of the bank’s net interest income to the bank’s total interest-earning assets. To put it simply, the net interest margin is equivalent to the profit margin of the banking industry. The higher the net interest margin, the higher the bank’s profitability and vice versa.
The chart below shows the net interest margin trend of China’s banking industry since 2011. As can be seen from the figure, the net interest margin of China’s banking industry has shown a clear downward trend in the past 10 years. And this is naturally not a good thing for banks that rely on net interest margins to make profits.
Trend of net interest margin of China’s banking industry since 2011.
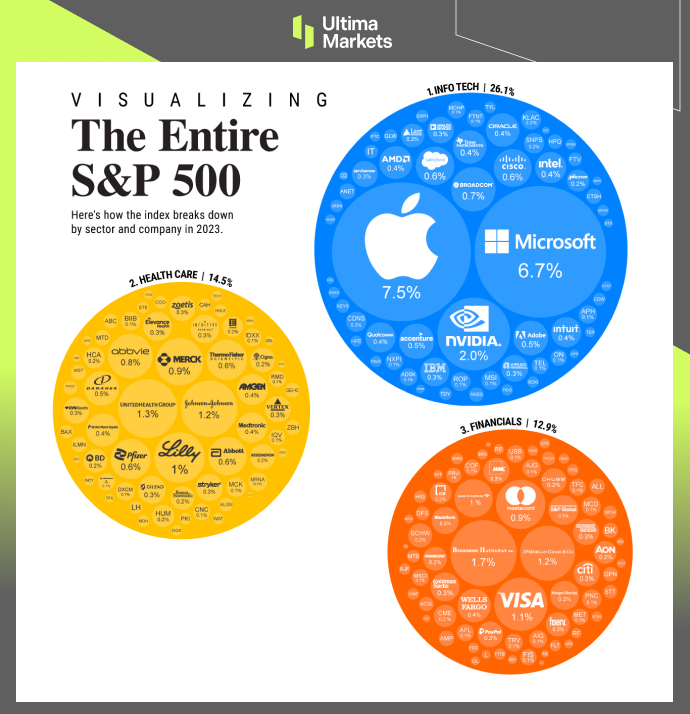
All in all, the current market structure of A-shares is basically dominated by the consumer industry and the financial and banking industries, and such a market structure is unable to support a higher market value. If A-shares really want to rival U.S. stocks in the future and achieve a long-term bull market, they will inevitably need to let their leading market value companies gradually shift to high-value-added industries such as the technology industry or the medical industry. Only by allowing these industries to take a dominant position can A-shares truly achieve “good long-term fundamentals.”
Breakdown of industries of shares in S&P 500 Index
When the A-shares markets can rebound?
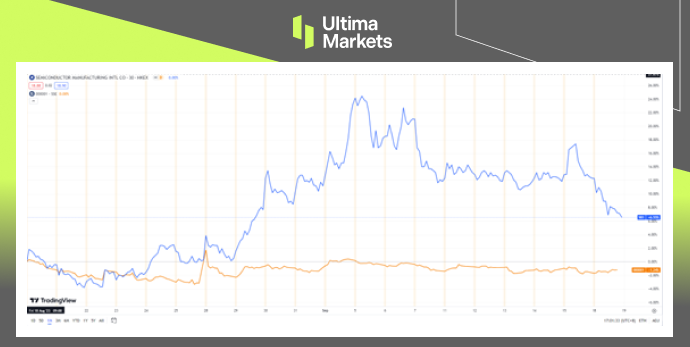
So can A-shares make those high-value-added technology industries the market capitalization leaders in the future? Combined with the continuous technological blockade imposed by the United States and other Western countries on China in recent years, it seems that there is little hope of achieving this goal. But what is surprising is that Huawei, which has been subject to US technology sanctions for four years, suddenly released the latest Mate 60 series mobile phones in a low-key manner without any publicity and promotion. Confirmed by Bloomberg News, its SoC adopts the 7nm process and is manufactured by SMIC. For China’s technology industry, this is undoubtedly the first glimmer of light after a long dark night. The blue line in the figure below represents the trend of SMIC share price in the Hong Kong stock market in the past month, while the orange line represents the trend of the Shanghai Composite Index during the same period.
The comparison of SMIC and Shanghai Composite Index in the past month
As we all know, China’s rapid economic development in the past two decades began with the real estate economy led by land finance. In combination with the foreign trade export industry, which was originally labor-intensive, it also created jobs for the city, thereby promoting urbanization development. However, as the international economic situation has become more turbulent in recent years, the demand for imported goods from China to developed countries such as Europe and the United States has continued to decline. The export-oriented export industries in the past have been hit first, which in turn has reduced urban employment, thus further accelerating the growth of China’s real estate industry.
Therefore, given China’s current economic situation, continuing to follow the old path of land finance or mid- to low-end foreign trade exports is definitely not a long-term option. If China wants to reverse its current sluggish economy and A-share dilemma, industrial upgrading is the only way. Because in the macro division of labor in the international industrial chain, using the so-called cheap demographic dividend to develop foreign trade OEM production is inherently the lowest-profit link. Only by occupying high-end links such as R&D and design and changing China’s current position in the international industrial chain can it bring more income to the overall economy and individual consumers. Only when incomes begin to truly increase and people’s expectations for the future improve, will China’s economy and the A-share market truly improve.
Summary
The Chinese market needs large-scale stimulus in the short term, but the large stimulus will not be conducive to long-term development. Therefore, the current stimulus measures introduced by China are relatively restrained, and the actual intensity is not particularly large.
Since the current industry structure of the A-share market is mainly focused on finance banking or consumption, and lacks high-value-added industries, it is impossible to essentially improve the long-term market conditions of A-shares.
Only by accelerating industrial upgrading can fundamentals of A-shares market truly improve in the future.
Disclaimer
The comments, news, research, analyses, prices, and all information contained in this article can only be regarded as general information and are provided only to help readers understand the market situation and do not constitute investment advice. Ultima Markets has taken reasonable steps to provide up-to-date information, but cannot guarantee the accuracy and may modify without notice. Ultima Markets will not be responsible for any loss incurred due to the application of the information provided.
Written on September 21, 2023 at 4:05 pm, by mervin
Comments Off on When China’s A-Shares Markets Can Bounce Back?