Fundamentally, UK is to release its latest August unemployment data on Tuesday. The previous PMI final value data for the manufacturing industry confirmed a downward trend, shrinking for the sixth consecutive month. If the job market shows weakness as well, although inflationary pressure decreases, the outlook for the UK economy may be interpreted as sluggish by the market.
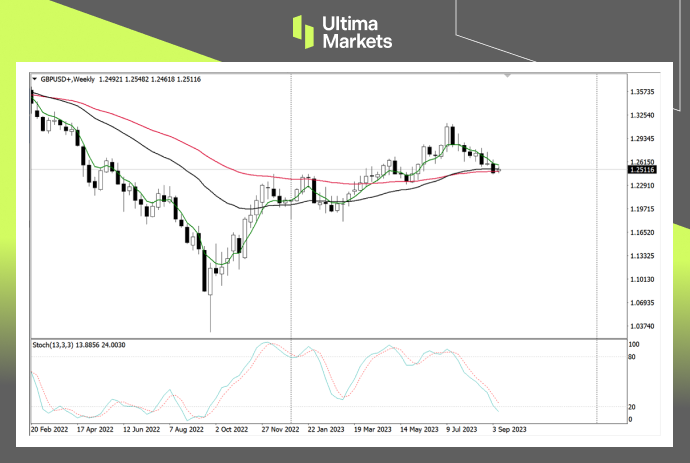
Technically, it can be observed from the weekly chart of the pound that although the random volatility indicator is still in a downward trend, the market is still trapped in the volatility range of the moving average group.
( Weekly chart of GBP/USD, source: Ultima Markets MT4)
The 5-week moving average suppressed the rebound in the exchange rate, while the 33-week and 65-week moving averages supported further downward movements in the market. There is still a possibility of further volatility in the market this week.
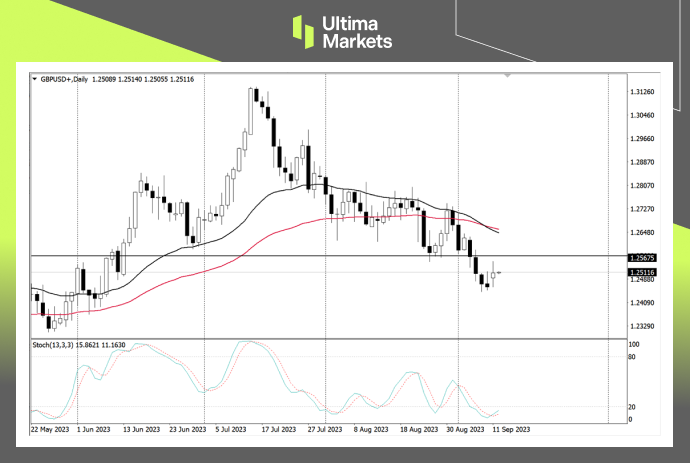
(Daily chart of GBP/USD, source: Ultima Markets MT4)
The short forces on the copper daily chart temporarily have the upper hand. The stochastic oscillator crosses downwards. Since the downward trend since early August has been a downward motive wave, there is a certain probability that the recent decline will continue the extended downward trend.
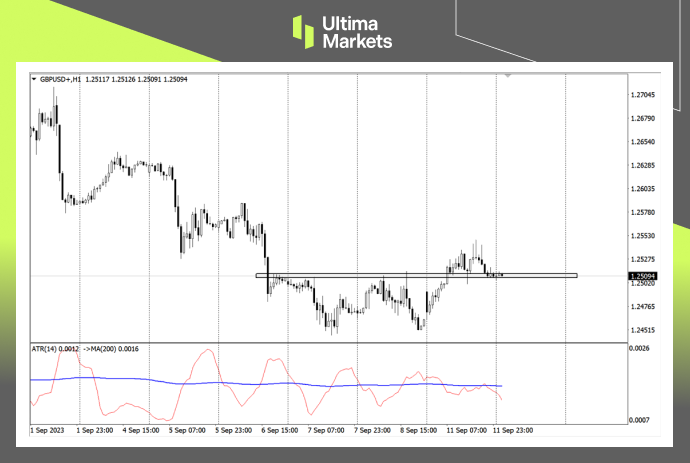
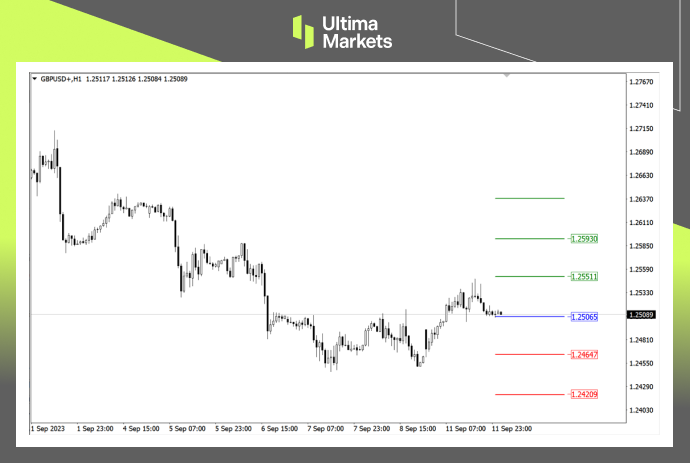
(1-hour chart of GBP/USD, source: Ultima Markets MT4)
On the daily chart, yesterday’s rebound in the market led to a random volatility indicator sending out a bullish signal, but due to yesterday’s K line being only a cross star, the upward momentum of the rebound may be limited. Even if the rebound continues, it is still necessary to conservatively look towards the resistance 1.25675.
(1-hour chart of GBP/USD, source: Ultima Markets MT4)
According to the pivot indicator in Ultima Markets MT4, the central price on that day is 1.25065,
Bullish above 1.25065, with the first target of 1.25511 and the second target of 1.25930
Bearish below 1.25065, with first target 1.24647 and second target 1.24209
Disclaimer
Comments, news, research, analysis, prices and other information contained in this article can only be regarded as general market information, provided only to help readers understand the market situation, and do not constitute investment advice. Ultima Markets will not be responsible for any loss or loss (including but not limited to any loss of profits) that may arise from the direct or indirect use or reliance on such information.
Written on September 12, 2023 at 3:12 am, by mervin
UK government debt has soared more than 40% since the Covid-19 outbreak in March 2020, reaching nearly 2.6 trillion pounds ($3.3 trillion), the highest level since the early 2020s and about the same as the country’s annual gross domestic product.
Inflation-Linked Debt: A Troubling Reality
Although some developed countries, for example, the US has debts as a high percentage in its GDP, the UK is unique in this case because 1/4 of its government debt is “index-linked to inflation”.
As prices surged in the UK over the past 18 months, so have government repayments of interest on inflation-linked bonds.
The Burden of High Inflation
In the latest fiscal year, high inflation resulted in the highest debt ratio in 40 years, weighing on the country’s finances as it grapples with weak economic growth and an election looming pressure.
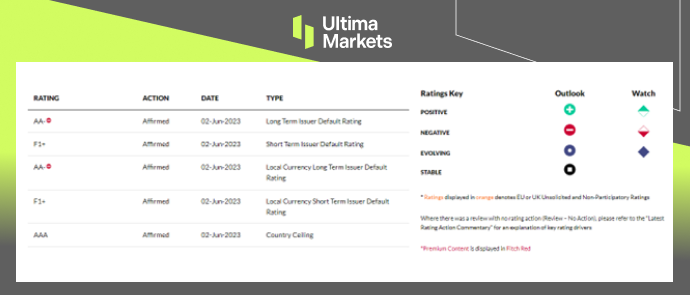
The credit ratings company Fitch said, “Britain has a higher debt-repay as a share of government revenue than any other advanced economy.”
The Looming Specter of Credit Downgrade
Britain’s growing debt burden puts it in a precarious position. A downgrade of the country’s credit rating could further raise borrowing costs, although the impact is likely to be limited.
Earlier this month, Fitch canceled the U.S.’s AAA rating, one of the reasons was the increase in the U.S. debt ratio.
Fitch ‘s current rating outlook on the UK is negative, which means the risk of the country’s rating being downgraded to A from the current AA- rating increases.
Future Outlook: Waiting for Rating Agencies’ Verdict
The UK’s financial landscape is poised for a significant transformation. Moody’s and S&P are set to release their assessments of the nation’s credit rating on October 20th, with Fitch following suit on December 1st.
These impending evaluations will play a pivotal role in shaping the UK’s financial future.
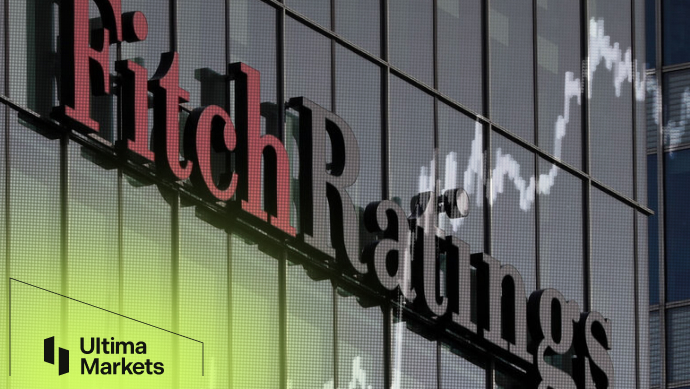
(UK ratings, Fitch)
Conclusion
In conclusion, the UK’s escalating government debt crisis demands immediate attention. As this hierarchical presentation illustrates, the mounting debt, coupled with inflation-linked complications, has profound implications.
The nation’s credit rating, currently at risk, hinges on the impending assessments by rating agencies. Staying informed and prepared for potential developments in the UK’s financial stability is of utmost importance.
Disclaimer
Comments, news, research, analysis, price, and all information contained in the article only serve as general information for readers and do not suggest any advice. Ultima Markets has taken reasonable measures to provide up-to-date information, but cannot guarantee accuracy, and may modify without notice. Ultima Markets will not be responsible for any loss incurred due to the application of the information provided.
Written on September 11, 2023 at 3:41 am, by mervin
Comments Off on The Surreal Saga of UK Government’s Skyrocketing Debt
Fundamentally, after the release of employment data and PMI data, metals are still under pressure due to potential secondary inflation risks in the United States. On the supply side, according to the latest statistics from the London Metal Exchange, copper inventories increased by 3,150 tons. The increase in inventories means that market demand has not expanded. These short-term news still did not lead to a significant decline in copper prices, suggesting that short-term copper still has room for long-term gains after digesting the market news.
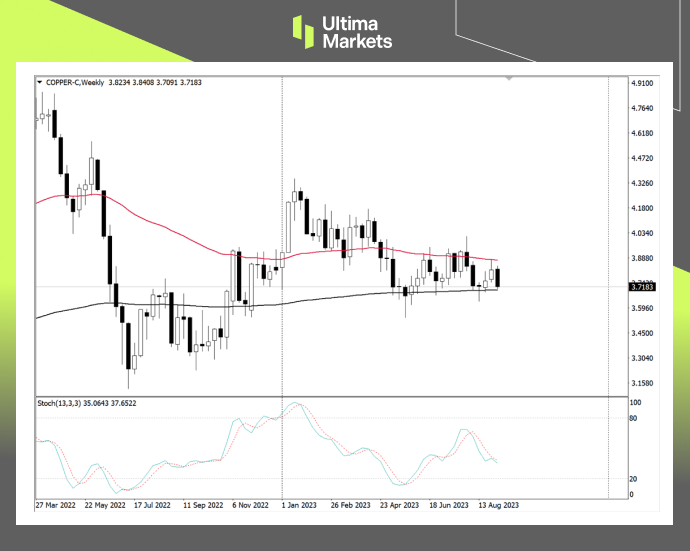
Technically, copper prices are once again close to the 200-week moving average on a weekly basis, and the market showed signs of resistance and rebound in the first two times.
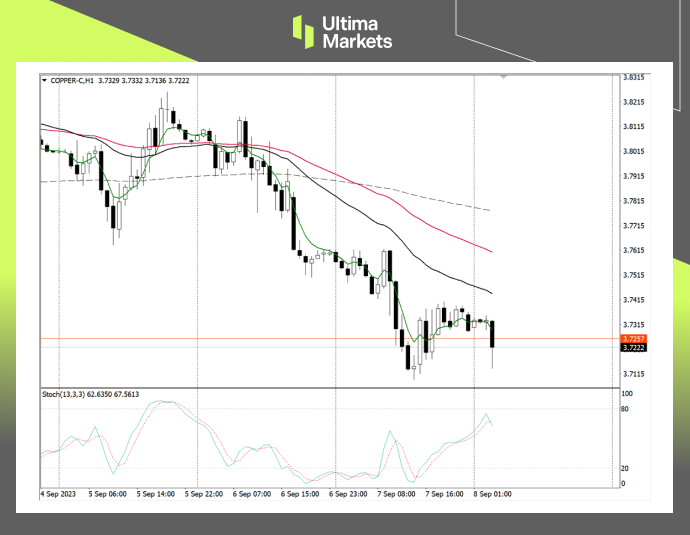
(Weekly chart of Copper, source: Ultima Markets MT4)
The 65-week moving average continues to suppress the upper rebound space of copper prices. Pay attention to whether the final closing price of the market today on Friday can effectively break the 200-week moving average. The market deserves to focus on the short trend next week.
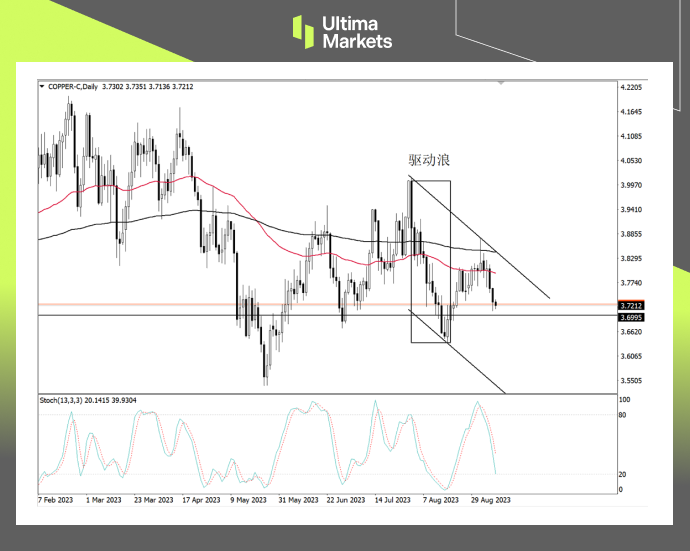
(Daily chart of Copper, source: Ultima Markets MT4)
The short forces on the copper daily cycle temporarily have the upper hand. The stochastic oscillator crosses downwards. Since the downward trend since early August has been a downward motive wave, there is a certain probability that the recent decline will continue the extended downward trend.
(1-hour chart of Copper, source: Ultima Markets MT4)
On the intraday 1-hour period, the stochastic oscillator has not entered the overbought area for the time being, and the market is still likely to be a mess. Even if the Asian market is currently falling, we need to wait for the short signal of the stochastic oscillator indicator to be confirmed, and then wait for the breakthrough of the low before we can focus on intraday short trading opportunities.
(1-hour chart of Copper, source: Ultima Markets MT4)
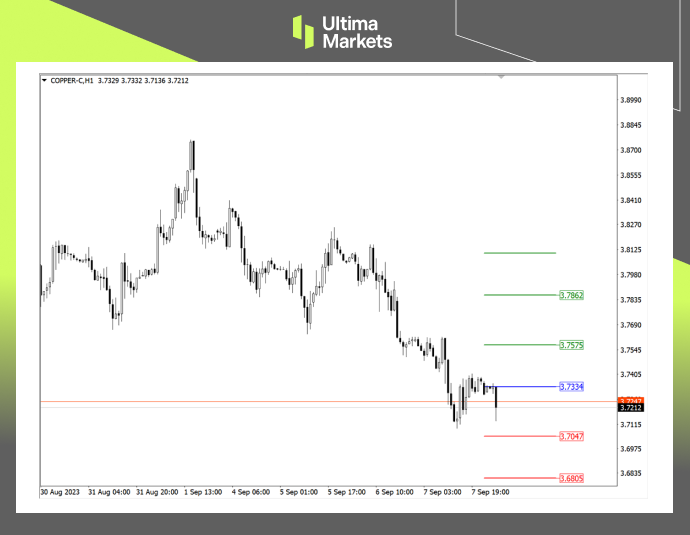
According to the pivot indicator in Ultima Markets MT4, the pivot price of the day is 3.7334.
Bullish above 3.7334, first target 3.7575, second target 3.7862
Bearish below 3.7334, first target 3.7047, second target 3.6805.
Disclaimer
Comments, news, research, analysis, prices and other information contained in this article can only be regarded as general market information, provided only to help readers understand the market situation, and do not constitute investment advice. Ultima Markets will not be responsible for any loss or loss (including but not limited to any loss of profits) that may arise from the direct or indirect use or reliance on such information.
Written on September 8, 2023 at 7:44 am, by mervin
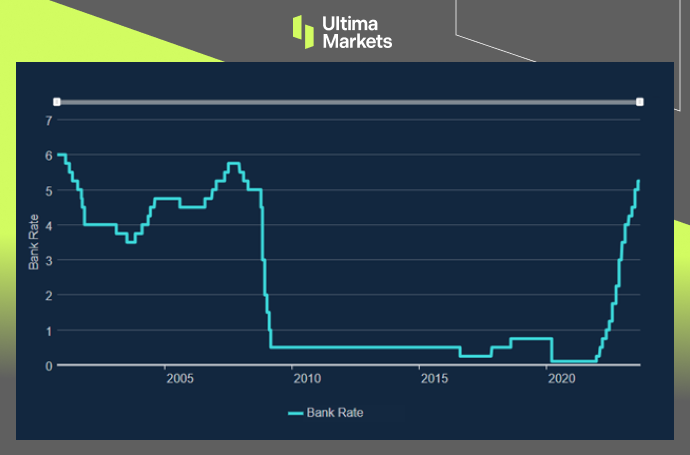
Bank of England Governor Andrew Bailey said at a Treasury Select Committee hearing on the 7th that the interest rate hike policy is close to the peak, and BoE’s Monetary Policy Committee will make another decision on September 21.
The Announcement
Britain’s annual inflation rate of 6.8 percent is higher than Prime Minister Rishi Sunak’s planned target of 5 percent by the end of 2023 and is the highest among G7 nations.
The governor explained that due to the increase in crude prices, the inflation data in August may be slightly higher than expected. At the same time, he believes that inflation will be obvious by the end of this year, especially in autumn.
In addition, he pointed out that the Monetary Policy Committee may finally vote in support of raising interest rates in September.
(Bank rate record, Bank of England)
Economic Insights
The Bank of England released a monthly survey on the 8th, showing output prices are expected to increase by 4.9% in the next 12 months. The figure, based on a three-month rolling average, was down 0.5 percentage from July and well below last year’s peak of 6.6% in September.
The outlook for wage growth has also dropped to an average of 5.1%, continuing a downward trend from a high of 6% in late 2022. The survey of recruiters points out a cooling labor market. The findings could slow the central bank’s pace of raising interest rates.
Conclusion
In conclusion, it’s evident that the United Kingdom is currently facing a challenging economic situation with a persistently high inflation rate and signs of a cooling labor market. The comments made by Bank of England Governor Andrew Bailey and the data from the recent survey have sparked discussions about the future of interest rates and economic stability.
As we move forward, it’s crucial for individuals and businesses to monitor these developments closely, as they have the potential to impact various aspects of the economy. Whether you are a trader, investor, or simply someone interested in economic matters, staying informed is the key to making well-informed decisions in these uncertain times.
Remember that financial markets can be volatile, and it’s advisable to seek professional advice and conduct thorough research before making any significant financial decisions. As we await the upcoming decision by the BoE’s Monetary Policy Committee on September 21, the economic landscape in the UK remains a topic of great interest and importance.
Disclaimer
Comments, news, research, analysis, price, and all information contained in the article only serve as general information for readers and do not suggest any advice. Ultima Markets has taken reasonable measures to provide up-to-date information, but cannot guarantee accuracy, and may modify without notice. Ultima Markets will not be responsible for any loss incurred due to the application of the information provided.
Written on September 8, 2023 at 7:15 am, by mervin
Comments Off on The UK’s Interest Rate Odyssey: Understanding the Essentials
August Service ISM Surged, Heating up Concerns Over Inflation
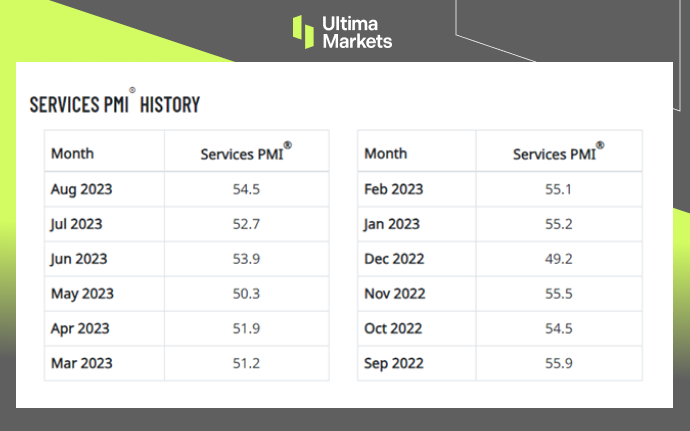
The Institute for Supply Management released the ISM services index for August, which showed a recovery in business activity. The index unexpectedly rose to 54.5 from market expectations of 52.5, up from 52.7 in July and reaching a six-month peak.
From the analysis of the service industry portfolio, as many as 13 of the 18 industries surveyed by the ISM non-manufacturing industry have increased.
Industries such as catering and accommodation, real estate leasing, construction, retail, transportation and warehousing have shown steady expansion of new order demand and willingness to recruit.
The service industry data was better than expected, driving up treasury yields, meanwhile, putting pressure on stock markets. The three major U.S. stock indexes all ended in decline.
The ISM Non-Manufacturing Index profile
The ISM Non-Manufacturing Index is a comprehensive indicator that tracks non-manufacturing activities such as employment trends, prices, new orders and other sub-items.
The index takes 50 as the critical point. If the index is at 50, it means that the economy of this month remains unchanged from the previous month; if the index is above 50 for several consecutive months, it indicates that non-manufacturing activities are expanding and prices are rising, implying that the overall economy is in expanding state.
On the contrary, when the index is below the 50 level, it means that the overall economy is in a state of contraction.
(Service PMI, Institute for Supply Management ISM)
Conclusion
The August ISM services index report has introduced a level of unpredictability and excitement to the financial landscape. It’s not just a data report; it’s a narrative, a story with twists and turns that continue to unfold.
To stay updated on this ever-evolving economic drama and gain access to expert analysis, make sure to follow our platform closely. We offer the key to unraveling the complex world of finance and economics, providing you with a structured approach to understanding the latest developments.
Disclaimer
Comments, news, research, analysis, price, and all information contained in the article only serve as general information for readers and do not suggest any advice. Ultima Markets has taken reasonable measures to provide up-to-date information, but cannot guarantee accuracy, and may modify without notice. Ultima Markets will not be responsible for any loss incurred due to the application of the information provided.
Written on September 7, 2023 at 9:33 am, by mervin
Comments Off on August ISM Surprise: A Perspective On Economic Fireworks
Fundamentally, yesterday the United States released ISM data on the service industry, just like the market outlook shared on Monday. The Fed is currently looking for data support. Consumption is one of the three economic carriages in the United States. The good performance of the ISM service industry PMI will greatly stimulate the bullish trend of the US dollar. The PMI data unexpectedly strengthened in August to 54.5, reflecting sustained strength in consumer demand and the overall economy and strengthening hopes that the United States can avoid recession. It also brings potential signs that inflation will still rise, and the dollar will maintain a certain bullish trend until the data is digested this week.
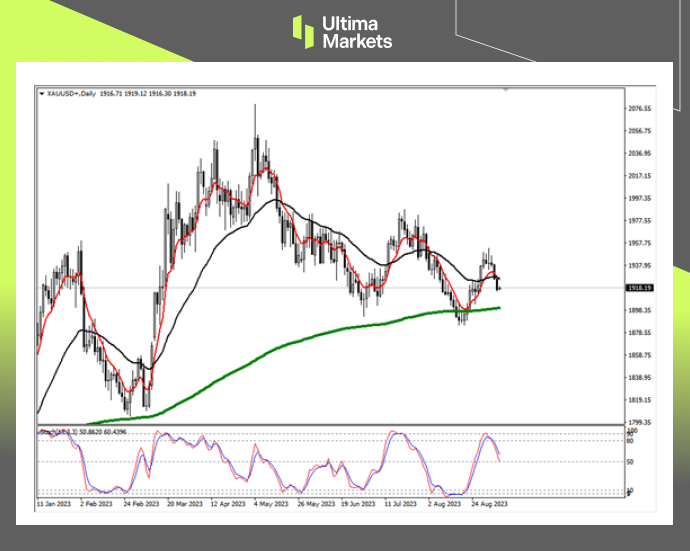
Technically, the gold finally fell below the 33-day and 7-day moving average yesterday, and the market’s short trend is relatively clear.
(Daily chart of XAU/USD, source: Ultima Markets MT4)
The stochastic oscillator also sent a short signal, and the market on the daily chart has a probability of going back to the moving average lines during the Asian session.
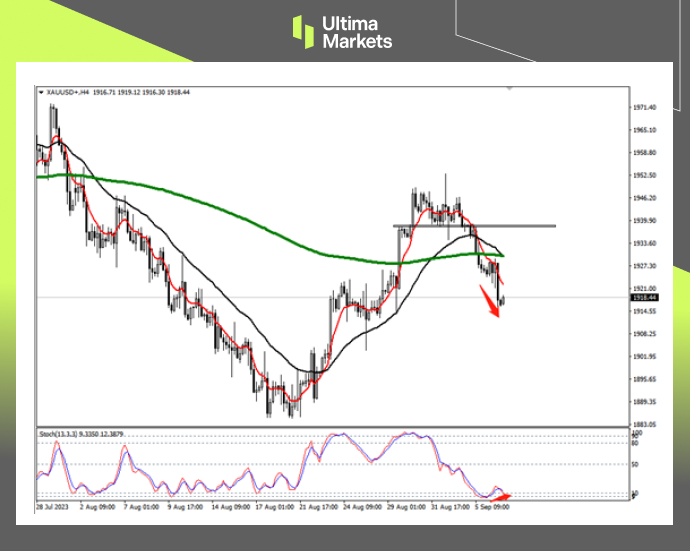
(4-hour chart of XAU/USD, source: Ultima Markets MT4)
On the 4-hour chart, after the market peaked and fell below the neckline this week, the moving average lines subsequently made a dead cross which is kind of short signal. It is worth noting that the stochastic oscillator currently indicates that the market is about to bottom out, and there is a certain probability of rebound or consolidation.
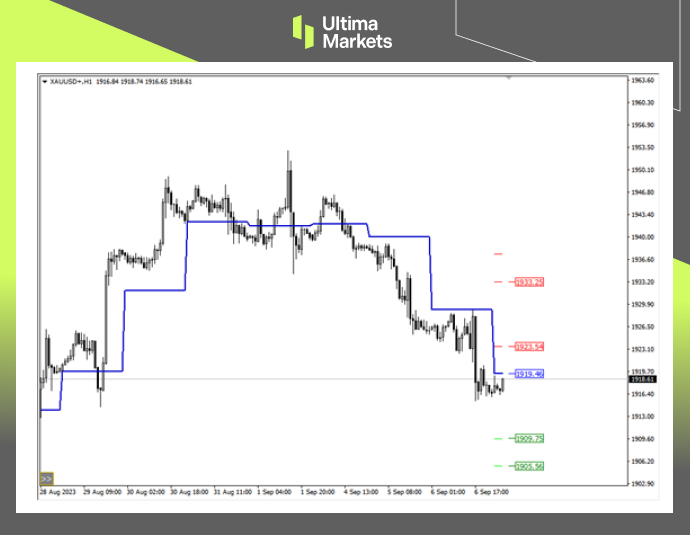
(1-hour chart of XAU/USD, source: Ultima Markets MT4)
According to the pivot indicator in Ultima Markets MT4, the pivot of the day was 1919.46.
Bullish above 1919.46, the first target is 1923.54, and the second target is 1933.25
Bearish below 1919.46, the first target is 1909.75, the second target is 1905.56
Disclaimer
Comments, news, research, analysis, prices and other information contained in this article can only be regarded as general market information, provided only to help readers understand the market situation, and do not constitute investment advice. Ultima Markets will not be responsible for any damage or loss (including but not limited to any loss of profits) that may arise from the direct or indirect use or reliance on such information.
Written on September 7, 2023 at 9:20 am, by mervin
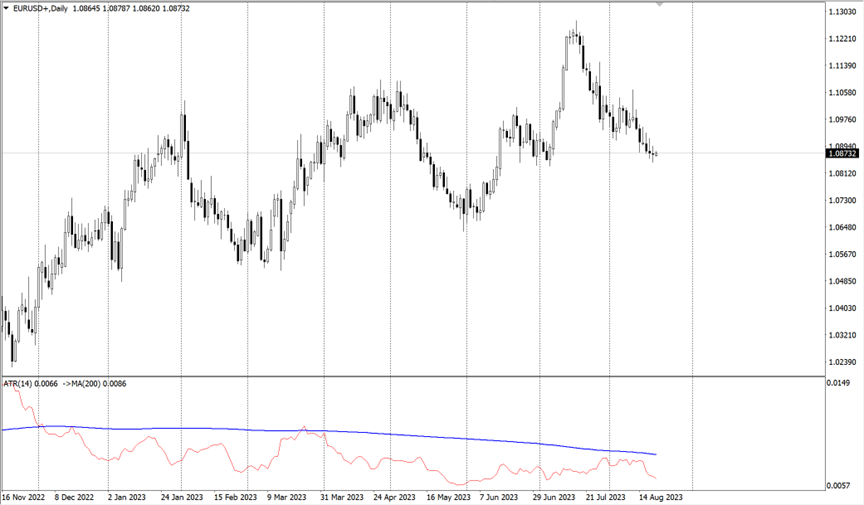
At last, the euro has shrugged off bad economic news and inflation has come under control. It might be the time for ECB to reconsider its tightening monetary policy . Investors will focus on whether the European Central Bank will pause interest rate hikes in September as expected.
(Inflation rates in the euro zone in the past year)
ECB’s Dilemma: To Hike or Not to Hike
The August PMI report due on Wed. is going to be in the spotlight. Forecasts show the manufacturing sector slumps further, and start to take a toll on services sector, endangering the euro zone economy.
With sluggish numbers, the ECB could take a break in September rate hike, however, the euro might receive a hit. Most economists believe the ECB will pause rate hikes in September but see room for an increase before the end of 2023 amid rising inflation.
Lagarde’s Utterances: A Market Barometer
Separately, at the Jackson Hole Global Central Bank Economic Symposium on Saturday, European Central Bank President Lagarde’s speech is going to be very important. Investors will look for clues from the review.
U.S. Economic Resilience
Based on data released in the past week, the US economy continued to maintain a strong momentum. Retail sales and manufacturing figures unexpectedly rose as residential numbers climbed. The strength of the U.S. dollar has caused the euro to remain in a downward trend.
(EUR/USD daily cycle, Ultima Markets MT4)
July 4th represents a turning point at present. If it is broken, the upward momentum will subside, leaving little hope for EUR/USD to stage a rebound.
Market Volatility: The Lagarde Effect
It is worth noting that the overall volatility of the euro against the US dollar has slowed down significantly. Both the overall volatility on the chart and the average level of the 200 -period ATR indicators are declining. As a result, Lagarde’s speech is going to shift the market volatility.
Conclusion
In conclusion, as we navigate the complex web of economic variables, ECB President Lagarde’s words loom large on the horizon.
The ECB’s delicate balancing act and the resilient U.S. economy have set the stage for a captivating narrative in the world of finance.
For investors and market participants, astutely decoding the signals emanating from these developments will be essential in making informed decisions.
Disclaimer
Comments, news, research, analysis, price, and all information contained in the article only serve as general information for readers and do not suggest any advice. Ultima Markets has taken reasonable measures to provide up-to-date information, but cannot guarantee accuracy, and may modify without notice. Ultima Markets will not be responsible for any loss incurred due to the application of the information provided.
Japan announced the latest July core CPI annual rate excluding fresh foods rose 3.1% year-over-year, slightly down from 3.3% in the previous month.
The figure matched with the Bank of Japan’s expectation. The slowdown is linked to lower energy prices, especially data from the Tokyo region showing a slight deceleration in inflation.
(Japan’s inflation level in the past year)
A Cautious Approach by the Bank of Japan
The BOJ’s holding back on raising rates makes a sharp contrast to its peers. The Bank of Japan has taken steps to curb potential economic risks, including allowing long-term government bond yields to rise to 1%. However, the monetary policies have not prevented the yen from depreciation.
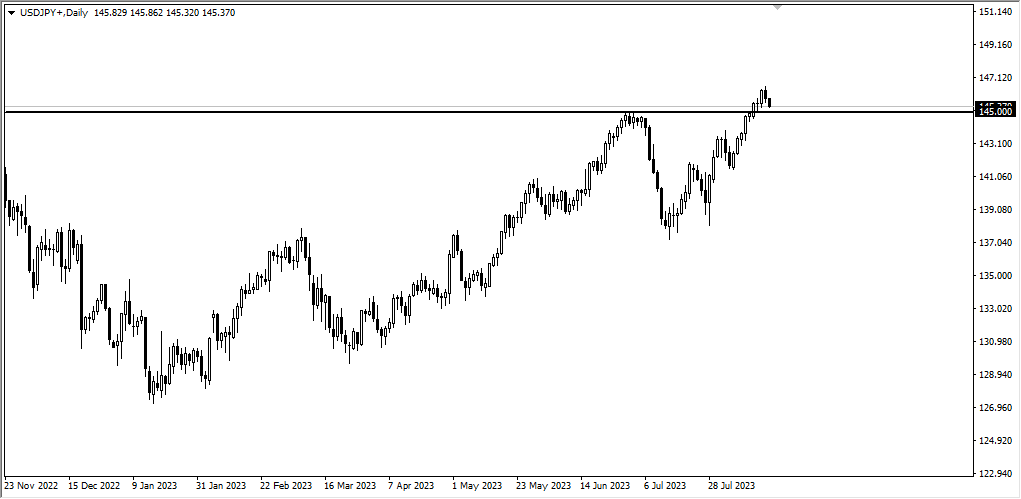
The USD/JPY Exchange Rate
The exchange rate of USD/JPY began to fall in the past two days but remained above the high of 145. Over time, Japan’s low rate could lead to capital outflows, putting downward pressure on the yen.
(USD/JPY daily cycle, Ultima Markets MT4)
External Factors at Play
The future of the yen is not solely determined by Japan’s economic policies. External factors, such as global crises or recessions, can play a crucial role in shaping the currency’s fate. A crisis or recession might deter further rate cuts, yet the strength of the U.S. economy reduces this possibility.
A Turning Point at 150
Although the Japanese government could intervene the yen’s depreciation, its long-term course might remain unchanged. 150 marks a turning point. If USD/JPY rises above it, the Bank of Japan is expected to step into the market.
The Ongoing Tug-of-War
In summary, Japan’s inflation levels and the state of the global economy continue to be key determinants in the yen’s value. Under the current circumstances, the Bank of Japan’s easing policy is likely to support the trend of yen depreciation.
However, it’s essential to remember that external factors can still bring about short-term changes in this delicate balance.
Disclaimer
Comments, news, research, analysis, price, and all information contained in the article only serve as general information for readers and do not suggest any advice. Ultima Markets has taken reasonable measures to provide up-to-date information, but cannot guarantee accuracy, and may modify without notice. Ultima Markets will not be responsible for any loss incurred due to the application of the information provided.
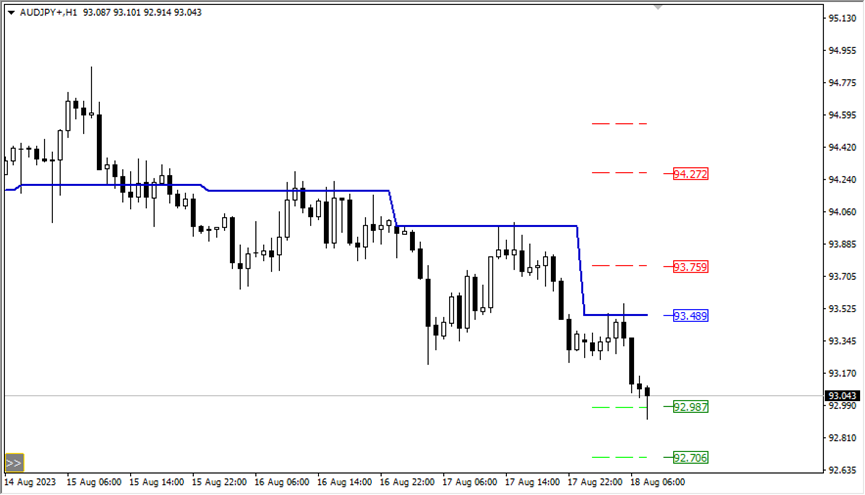
Fundamentally speaking, Japan’s inflation has not declined, which increases the probability of the Bank of Japan’s future tightening policy. After a long-term depreciation, the yen has space for a short-term rebound. AUD/JPY has less room for arbitrage than USD/JPY. With strong USD, please watch out for AUD/JPY bear.
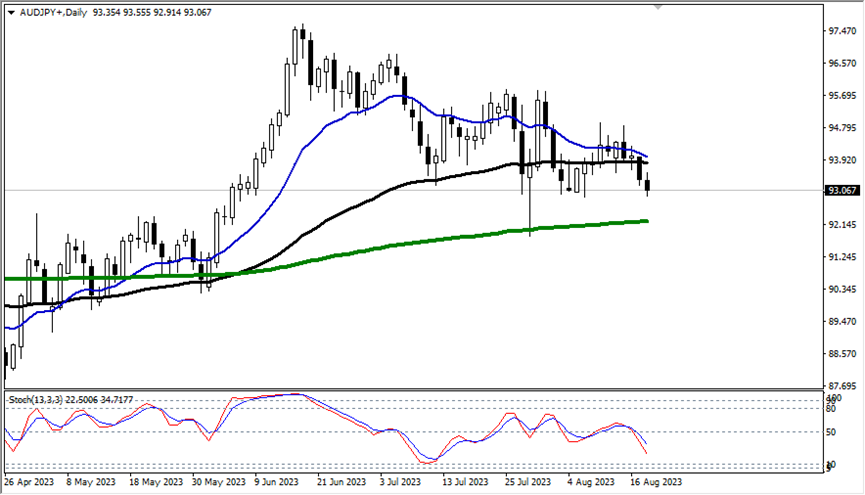
Technically speaking, the AUD/JPY daily stochastic oscillator shows a dead cross, falling below the 50 median line.
(Golden daily cycle, Ultima Markets MT4)
The exchange rate began to decline after falling below the 65- day moving average. It is worth noting that before the short-term moving average crosses again, the market has a high probability of touching the 240 -day moving average and rising again.
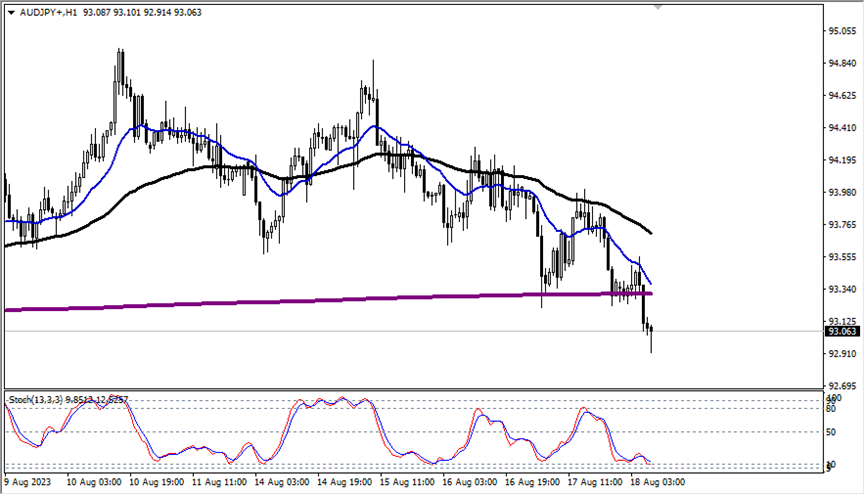
(AUD/JPY in 1 -hour period, Ultima Markets MT4)
In 1-hour period, the bearish trend is obvious, and the exchange has fallen below the 2400 -period moving average. However, there is a certain probability that it will find support and rebound there. You may wait for short entry here.
(AUD/JPY in 1 -hour period, Ultima Markets MT4)
According to the pivot indicator in Ultima Markets MT4, the central price is 93.489,
Bullish above 93.489, the first target is 93.759, and the second target 94.272.
Bearish below 93.489, the first target is 92.987, and the second target is 92.706.
Disclaimer Comments, news, research, analysis, price, and all information contained in the article only serve as general information for readers and do not suggest any advice. Ultima Markets has taken reasonable measures to provide up-to-date information, but cannot guarantee accuracy, and may modify without notice. Ultima Markets will not be responsible for any loss incurred due to the application of the information provided.
Let’s turn the clock back to the end of last year. At that time, most investors and economists predicted that the US economy would inevitably suffer a recession in 2023 because of the environment of high interest rates.
But today, at the end of July, the Federal Reserve once again raised the federal funds rate by 25 basis points, lifting the target range of the rate to 5.25% to 5.5%, the highest level since 2001.
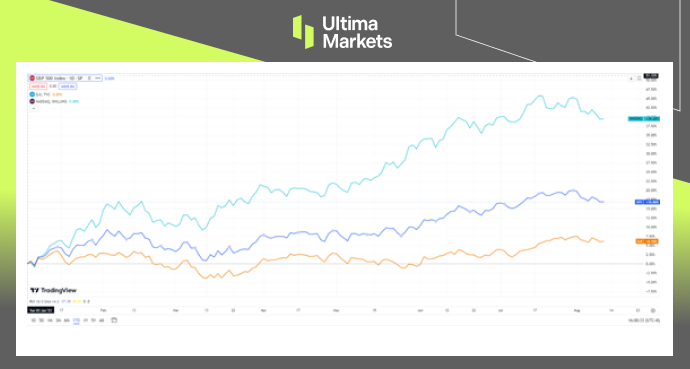
However, the US economy shows no sign of recession. As of writing, the US NASDAQ, S&P 500 and Dow Jones index went up 39.45%, 16.86% and 6.16% respectively so far this year.
So, will there still be a recession? If there is still the possibility of a recession, when will it happen?
The three major indexes of U. S. stocks are still rising so far this year.
Current situation: the market is still strong
Judging from the current market situation, the US Commerce Department announced on July 27th that GDP in the second quarter of this year grew 2.4% from a year earlier, up from 2% in the first quarter.
At the same time, the Ministry of Commerce said that compared with the first quarter of this year, the higher GDP growth rate in the second quarter reflected a rebound in private sector inventory investment and an increase in non-residential fixed investment. This seems to suggest that the US economy will not experience a hard landing any time soon.
Coincidentally, the US labor market has also shown resilience. The labor department announced on August 4th that the unemployment rate fell to 3.5% in July, down 0.1% from June and nearing a half-century low, while wages rose slightly, with the average hourly wage rising 0.4% in July from a year earlier. The current low unemployment rate also reflects a robust US economy.
Let’s take another look at the inflation data that the Fed is most concerned about. The US Bureau of Labor Statistics reported that the consumer price index (CPI) rose 3.2% in July from a year earlier, up slightly from 3% in June, reflecting rising food prices and still high housing costs.
But beyond that, the rest of the inflation-related data was mostly good news, especially the core CPI data, which excludes food and energy items, slowed further from a year earlier, from 4.8% in June to 4.7% in July. Although inflation has not been suppressed yet, the overall situation has improved significantly than before.
In short, there is a lot of data showing that market vitality is still strong, and it seems that the risk of recession is getting farther and farther away.
Looking back on history: the Truth behind high interest rates
Although the US economy is not showing obvious signs of recession at the moment, is this enough to indicate that recession fears are not enough to worry about? As the saying goes, there is nothing new under the sun. If we look back on history, it is not difficult to find that this may not be the time to rest easy.
In February 2008, it was only months before the collapse of 158-year-old Lehman Brothers. But Ben Bernanke, then chairman of the Federal Reserve, said that while the economic situation was not optimistic, he did not think the US economy would be at risk of recession. And at that time, there were not a few economists who supported this view.
When it comes to the financial crash that swept the global economy in 2008, this crisis actually did not appear at the peak of the high interest rate environment. Contrary to most people’s stereotype, the “Lehman moment” came after the Fed had cut interest rates sharply in a row.
In order to cool the apparently overheated housing market at that time, the Federal Reserve raised the federal funds rate to a high of 5.25% on June 29, 2006, and maintained it for more than a year.
It was not until September 18, 2007, that interest rates were cut by 50 basis points. By the time Lehman collapsed in September 2008, the federal funds rate had already fallen to 2%, entering a low-interest environment.
So, here comes the question, why is the recession still breaking out when interest rates have fallen and the pressure for high interest rates is gone? To answer this question, we need to quote an economic concept here: real interest rate.
The so-called real interest rate refers to the real interest rate level shown by the nominal interest rate after excluding the impact of inflation. If it is expressed in a mathematical formula, it is:
Real interest rate = Nominal interest rate – Inflation rate
Understanding the concept of real interest rates will be of great significance for us to analyze the truth behind high interest rates in the United States! Because corporate borrowing is a normal phenomenon in economic activity. Since borrowing is involved, interest rates are naturally an unavoidable topic. Only at favorable interest rates can the economy get a corresponding boost.
Let’s give a few simple examples here. It is a well-known fact that the inflation rate in the United States remained high last year. Let’s assume that at some point last year, inflation rate was as high as 8%, while the nominal interest rate in the United States was 4%. The high interest rate level of 4% seems to put a lot of pressure on corporate borrowing. However, once we introduce the concept of real interest rate, we will find that the interest rate level of 4% interest rate will not cause any pressure.
Because 4% (nominal interest rate) minus 8% (inflation rate), you get a real interest rate of -4%. At this time, the real interest rate is simply negative. In other words, although enterprises bear the cost of interest rates of 4%, due to the existence of 8% inflation, the prices of products or services produced by enterprises will naturally be pushed up by 8% by inflation.
As a result, enterprises can still make a profit of 4% just from borrowing. Therefore, as long as the real interest rate is negative, simply high nominal interest rates will not necessarily have a recession impact on the economy, because the cost of debt is negative. This is the reason why U. S. stocks still rise all the way in a high interest rate environment.
But let’s give another example. What if nominal interest rates go up all the way and inflation rate starts to fall? For example, suppose the nominal interest rate rises to 5%, while inflation falls to 3%. In this case, the real interest rate becomes +2%, and the previously negative cost of debt has been completely turned into a positive number. And this is what is happening to the US economy right now.
So, what kind of pressure will happen to the economy once real interest rates are negative? With regard to this question, we only need to look back at the past history and the answer is clear at a glance.
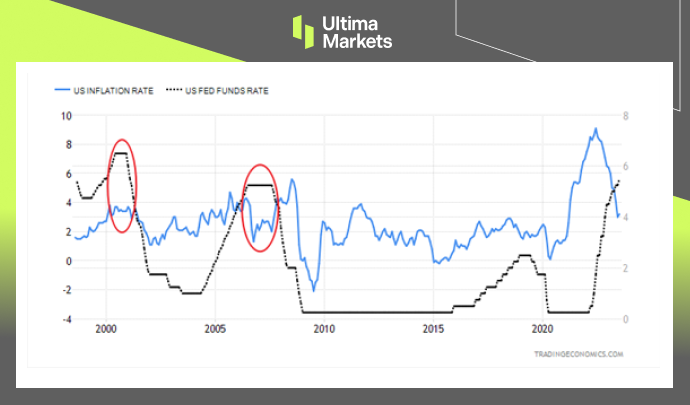
The trend of US inflation and the federal funds rate over the past 25 years.
The blue line: the US inflation rate; the black line: the federal funds rate (or the nominal interest rate).
By looking at the chart above, we can clearly see that in the past 25 years, there are two time periods when the nominal interest rate is higher than the inflation rate, or namely the real interest rate is positive. These two time periods correspond to the two red circles in the above chart.
These two periods roughly correspond to the dotcom crisis in the United States in 2000-01 and the global financial crisis in 2007-08. Thus, when the cost of debt is negative, economic activities tend to develop smoothly, and once the cost of debt is positive, crises often follow.
Outlook: the hidden danger of recession has not been eliminated
Bloomberg conducted a poll among economists last December when 70% of economists thought the US economy would suffer a recession within the next 12 months. But by July this year, that number had fallen to 58%.
Similar surveys are common in many mainstream financial institutions. Goldman Sachs, which thought there was no recession in the US economy as early as last year, further lowered the probability of a recession in the next 12 months to just 20% in July.
It seems that the risk of recession has once again been forgotten by economists. But through the above analysis of real interest rates and a review of history, we can see that the hidden dangers of the current recession have not been completely eliminated.
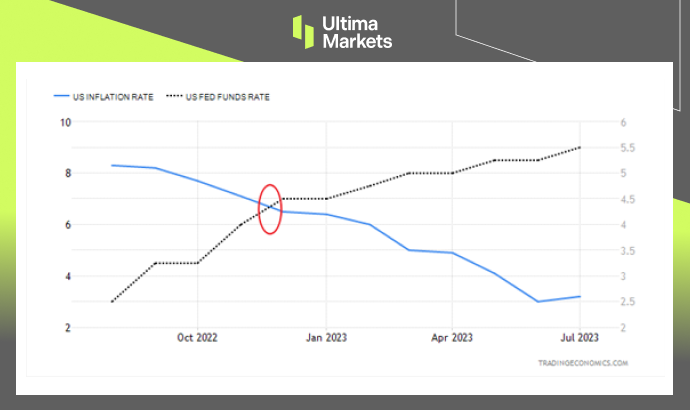
The trend of US inflation and the federal funds rate over the past year.
The blue line: the US inflation rate; the black line: the US federal funds rate (or the nominal interest rate).
The chart above reflects the trend of US inflation and the federal funds rate over the past year. The red circle in the picture reflects that real interest rates have reached a turning point from negative to positive at the end of last year and the beginning of this year.
Of course, the real interest rate can only be regarded as a temporary transition from negative to positive. But it is not clear whether this situation will last for a long time in the future. If the Fed adjusts its interest rate policy in time, or if inflation rises repeatedly, real interest rates are still likely to return to negative territory. In short, real interest rates already pose a potential danger to the possible risk of recession.
Just as real interest rates in the US showed signs of turning from negative to positive, in August, Fitch Ratings, one of the world’s three largest rating agencies, suddenly downgraded the US credit rating, downgrading its long-term rating from “AAA” to “AA+”. For the downgrade, Fitch said it was mainly due to several key drivers:
1.The level of governance in the United States has deteriorated:
Federal debt has remained high for years, and repeated debt-limit political standoffs and last-minute resolutions have eroded confidence in fiscal management. All these show that the level of governance in the United States has deteriorated, and public confidence in the government’s financial management has also been undermined.
2.Rising government deficits:
Fitch expected the general government deficit to rise to 6.3% of GDP in 2023, from 3.7% in 2022, reflecting cyclically weaker federal revenues, new spending initiatives and a higher interest burden. Additionally, state and local governments were expected to run an overall deficit of 0.6% of GDP this year after running a small surplus of 0.2% of GDP in 2022.
Fitch also forecasted a government deficit of 6.6% of GDP in 2024 and a further widening to 6.9% of GDP in 2025. The larger deficits will be driven by weak 2024 GDP growth, a higher interest burden and wider state and local government deficits of 1.2% of GDP in 2024-2025.
3.General government debt to climb:
Fitch predicted that US general government debt as a share of GDP will continue to climb, reaching 118.4% in 2025. That is more than 2.5 times higher than the median of 39.3% for “AAA” and 44.7% for “AA” sovereign countries. Fitch’s long-term forecasts show that the debt-to-GDP ratio will rise further, which will increase the vulnerability of US finances to future economic shocks.
Summary
It is worth mentioning that the fattest brown bears usually exist in the autumn before hibernation, and when winter goes to spring, brown bears are instead the weakest.
It is as if before the recession, countries often had plenty of tools in their fiscal toolboxes, which needed to be consumed in order to deal with risks. If there is a day when there are few fiscal instruments left, leaving the Fed with no choice but to slash interest rates, a recession will then be inevitable.
Therefore, in the future, the market should no longer pay more attention to whether the Fed will continue to raise interest rates, but instead focus on what attitude or way the Fed will use to create the expectation of interest rate cuts in the future. This will deserve further attention from the market in the future.