Mastering Holiday Spending in Times of Economic Uncertainty
A new CNBC-Morning Consult survey has found that 92% of adults have reduced their spending over the past six months, and plan to spend less through the holidays.
The Core Insight
Consumers remain cautious in their spending due to job insecurity and inflation. The most common categories for spending cuts over the past six months were clothing and apparel (63%), restaurants and bars (62%), and entertainment outside the house (56%), a pattern that held steady from our June survey. The next biggest categories for cuts were groceries (54%), recreational travel and vacations (53%), and electronics (50%.)
Looking ahead to the holiday shopping season, a warning for retailers: More than three-quarters of all U.S. adults surveyed (76%) plan to cut back on spending for non-essential items, and 62% expect to cut back on essential items “sometimes” or “more often” over the next six months, the survey found.
Just how acutely consumers reported feeling the impact of the current economic situation varied among socio-economic groups. And it wasn’t always those making the least that reported feeling most pinched.
Impact Across Socio-Economic Groups
More than half (55%) of households earning $50,000 or less (lower-income) said they’re feeling the impact of the economy on their personal finances, while 61% of households with $50,000 to $100,000 (middle-income) and 46% of households making at least $100,000 (higher-income) reported the same.
However, Higher-income households are in fact moving toward feeling that the economic situation is having a positive impact, the survey reports 30% in September, up from 21% in June.
Conclusion
In light of the economic uncertainty, a significant portion of Americans is adjusting their spending habits, especially as they approach the holiday season.
While these changes in consumer behavior pose challenges, they also offer opportunities for individuals to reevaluate their financial priorities and develop prudent spending habits.
By following these strategies and adapting to the current economic landscape, you can make the most of the holiday season while safeguarding your financial well-being.
Disclaimer
Comments, news, research, analysis, price, and all information contained in the article only serve as general information for readers and do not suggest any advice. Ultima Markets has taken reasonable measures to provide up-to-date information, but cannot guarantee accuracy, and may modify without notice. Ultima Markets will not be responsible for any loss incurred due to the application of the information provided.
Written on September 19, 2023 at 3:38 am, by mervin
Comments Off on Navigating Reduced Holiday Spending Amid Economic Uncertainty
The European Central Bank’s Recent Interest Rate Hike and Its Impact on the Euro
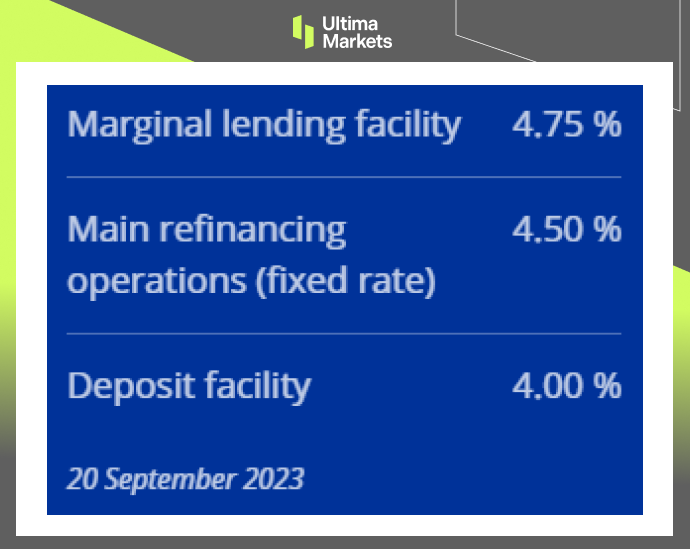
The European Central Bank (ECB) raised the three key interest rates by 25 bps.
Starting from September 20, 2023, the marginal lending facility, main refinancing operations, and deposit facility will increase to 4.75%, 4.50%, and 4.00% respectively, setting a record since the euro was introduced in 1999.
(Latest ECB interest rate, ECB)
A Historic Interest Rate Shift in ECB
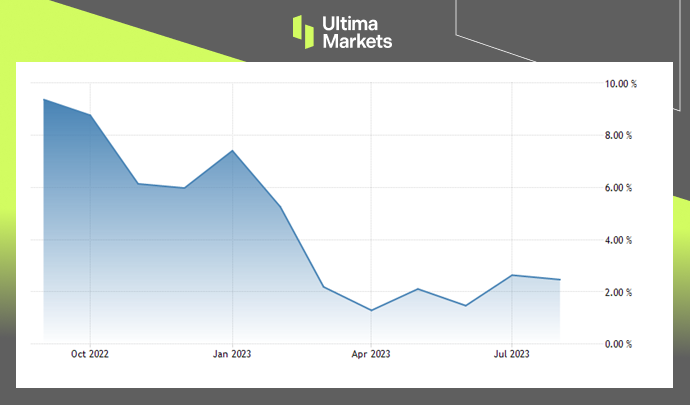
The ECB raised the benchmark interest rate from a historical low of -0.5% to the current record high in 20 years and 14 months.
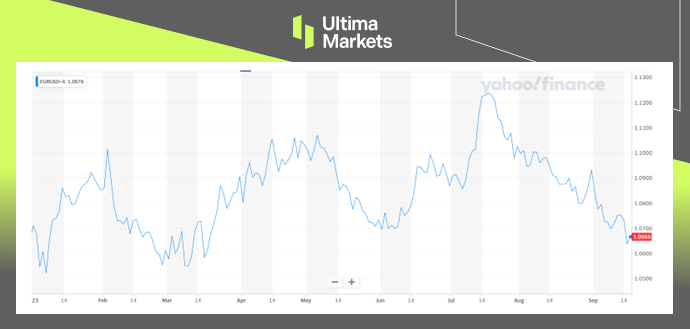
Although Eurozone inflation has cooled, reaching 5.3% in August, the same as in July, it is still far beyond the 2% target. Rising interest rates put pressure on the euro, which fell to its lowest level against the dollar in five months.
(EUR /US YTD Chart)
ECB’s Inflation Control and Economic Growth Prospects
European Central Bank President Christine Lagarde said at the press conference that inflation in the eurozone has been hovering at a high level for too long, core inflation is still too high, and food and energy costs continue to put upward pressure on prices.
She reiterated that the ECB is committed to bringing inflation back to its 2% target. At the same time, the economy is expected to grow by 0.7% this year, 1% next year, and 1.5% in 2025, which is lower than the previous forecast growth of 0.9%, 1.5%, and 1.6%.
The Global Implications
The ECB’s move has not only had a profound impact on the Eurozone but has also sent ripples across the global financial landscape. It underscores the central bank’s unwavering commitment to achieving price stability, even at the expense of economic growth prospects.
In conclusion, the ECB’s decision to raise interest rates to their highest levels in over two decades is a clear signal of its determination to tackle inflation. While this move may have consequences for the Euro and economic growth in the short term, it demonstrates the central bank’s commitment to maintaining price stability in the Eurozone.
Disclaimer
Comments, news, research, analysis, price, and all information contained in the article only serve as general information for readers and do not suggest any advice. Ultima Markets has taken reasonable measures to provide up-to-date information, but cannot guarantee accuracy, and may modify without notice. Ultima Markets will not be responsible for any loss incurred due to the application of the information provided.
Written on September 18, 2023 at 2:58 am, by mervin
Comments Off on ECB’s Recent Interest Rate Hike: A Closer Look at Implications
Unveiling the Robust U.S. Economic Landscape Ahead of the Federal Reserve Meeting
The Bureau of Labor Statistics released three statistical reports on September 14:
1. Retail sales
U.S. retail sales in August increased by 0.1% on a monthly basis higher than market expectations, and the annual growth rate increased from 2.6% to 2.5%. Retail sales in August were mainly driven by the sharp increase in gas station sales mom from 0.1% to 5.2%, reflecting the rebound in oil prices.
Other categories also generally showed positive growth, with more significant increases including automobiles and parts from -0.4% to 0.3%, electronics Supplies -1.1%→0.7%, and dining out and catering 0.8%→0.3% showed a slowdown.
Overall, retail sales in August were partly due to the recovery in gasoline prices, but retail sales excluding automobiles and gasoline were also higher than market expectations. (0.2% vs. 0.1%), the control group dropped from 0.7% to 0.1%, which was still better than the market expectation of -0.1%, highlighting that the US consumer market is still strong.
(Retail Sales data, BLS)
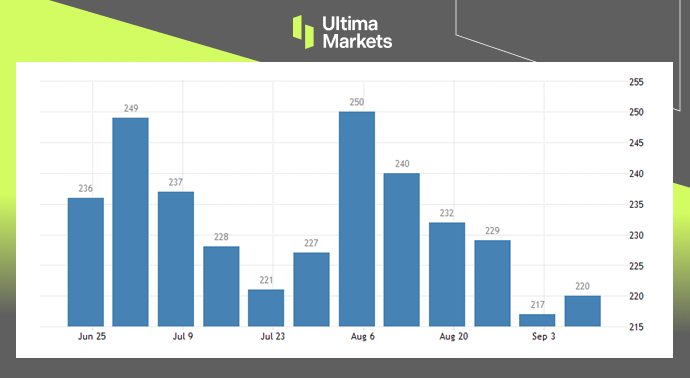
2. Initial jobless claims
Last week, the number of initial claims for unemployment benefits increased by 3,000 from 217,000 to 220,000, lower than the expected 225,000.
The number of continuing claims for unemployment benefits in the previous week increased by 4,000 from 1.684 million to 1.688 million, which was lower than the market estimate of 1.69 million people, showing that the job market is cooling more slowly than expected.
(Initial Jobless Claims, BLS)
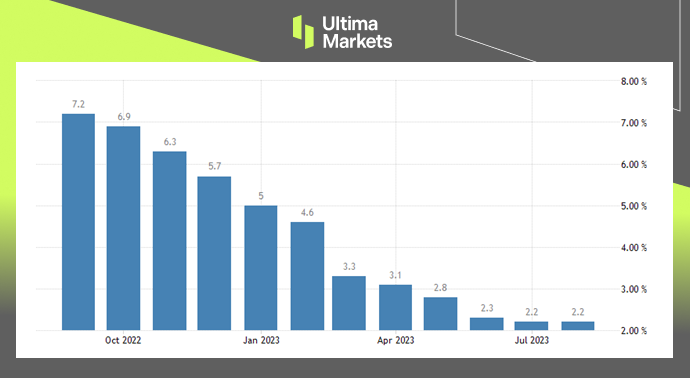
3. PPI (Producer Price Index)
The August producer price index (PPI) increased by 1.6% year-on-year, higher than market expectations of 1.2% and the previous value of 0.8%, growing for the second consecutive month.
Excluding volatile food and energy prices, the August core PPI rose by 2.2% YoY, in line with market expectations and lower than the previous value of 2.4%.
The growth of PPI in August was mainly driven by rising energy and transportation costs.
(Core PPI, BLS)
Disclaimer
Comments, news, research, analysis, price, and all information contained in the article only serve as general information for readers and do not suggest any advice. Ultima Markets has taken reasonable measures to provide up-to-date information, but cannot guarantee accuracy, and may modify without notice. Ultima Markets will not be responsible for any loss incurred due to the application of the information provided.
Written on September 15, 2023 at 3:24 am, by mervin
Comments Off on Data Revealing the Solid U.S. Economy Before Fed Meeting
Fundamentally, the continued rise in oil prices this week has driven market demand for the Canadian dollar and promoted the appreciation of the Canadian dollar. This has also made the implementation of the Bank of Canada’s monetary policy more difficult to a certain extent. In the short term, oil prices affect the appreciation trend of the Canadian dollar. However, as Canada’s real per capita GDP shrank year-on-year in the second quarter, the unemployment rate began to rise in May, and coupled with the continued drag on mortgage loan renewals, Canada’s price level may go downward. Therefore, if there are no unexpected changes in supply and demand in the crude oil market, it may be difficult to change the Bank of Canada’s stance of keeping interest rates unchanged at the October meeting.
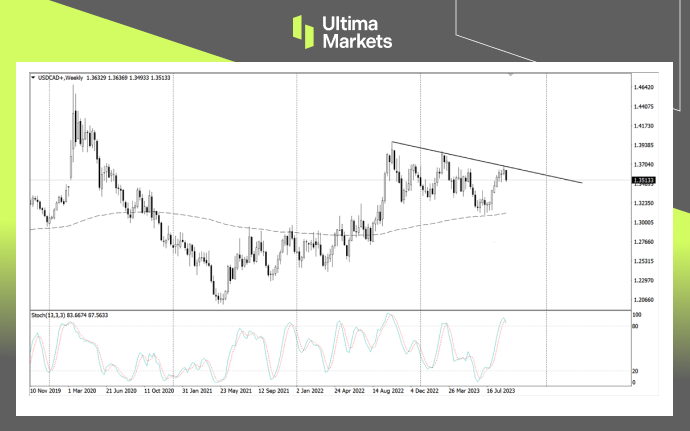
Technically, the downward trend line on the weekly chart of USD/CAD effectively prevents the exchange rate from rising further. After encountering resistance last week, it has entered a downward trend this week. However, the stochastic oscillator has a clear short signal, and we need to wait for the final closing today.
(Weekly chart of USD/CAD, source: Ultima Markets MT4)
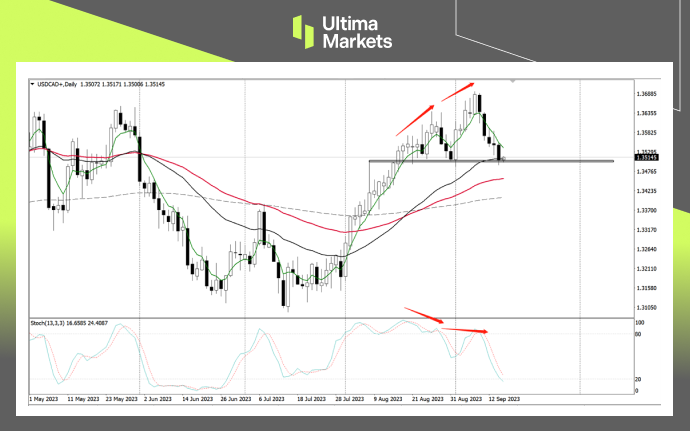
The market has started an upward trend since hitting the 200-week moving average in mid-August. Based on the complete five-wave structure of the entire upward trend, the current decline is temporarily judged to be an adjustment structure of the previous upward trend. After sufficient adjustment, the Canadian dollar may further depreciate.
(Daily chart of USD/CAD, source: Ultima Markets MT4)
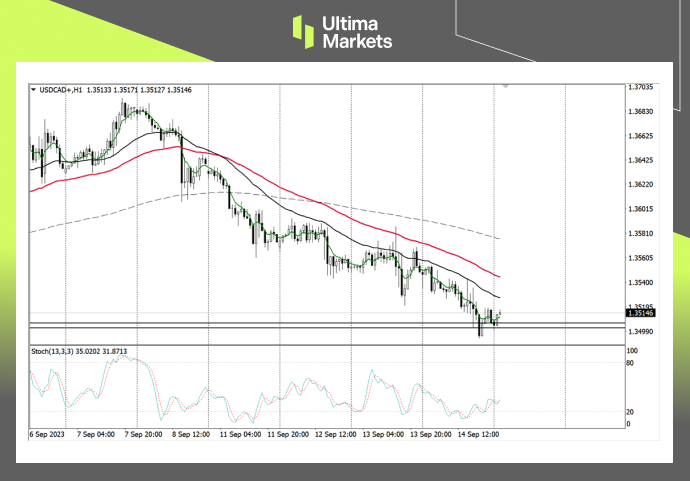
On the daily chart, the rate has reached a very critical support position against the Canadian dollar. The market finally retreated after the stochastic oscillator signaled a double divergence. At present, it has fallen to near the 33-day moving average. The clear top structure means that the current support position is a strong resistance area, and bulls may usher in a “counterattack” in this area during the day.
(1-hour chart of USD/CAD, source: Ultima Markets MT4)
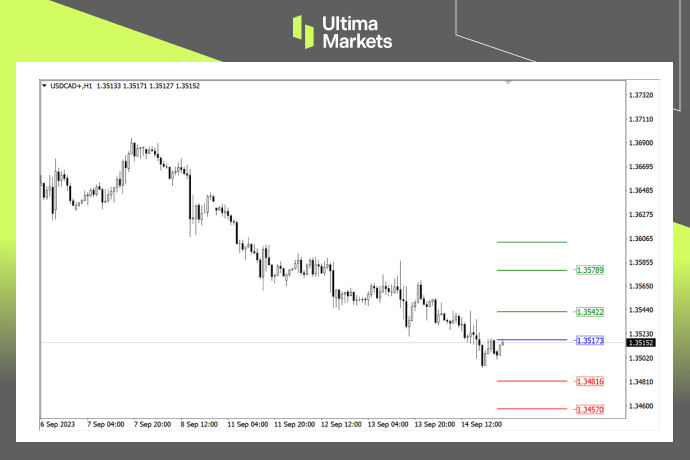
On the 1-hour chart, the oscillator also sent out a bottom divergence signal yesterday, and the market is likely to consolidate or rebound in the short term. If the market breaks through 1.35173 during the Asian session, traders can focus on rebound trading opportunities during the day. The first target is around the red 65 moving average.
(1-hour chart of USD/CAD, source: Ultima Markets MT4)
According to the pivot indicator in Ultima Markets MT4, the central price of the day was 1.35173.
Bullish above 1.35173, the first target is 1.35422, the second target is 1.35789
Bearish below 1.35173, first target 1.34816, second target 1.34570
Disclaimer
Comments, news, research, analysis, prices and other information contained in this article can only be regarded as general market information, provided only to help readers understand the market situation, and do not constitute investment advice. Ultima Markets will not be responsible for any loss or loss (including but not limited to any loss of profits) that may arise from the direct or indirect use or reliance on such information.
Written on September 15, 2023 at 3:03 am, by mervin
Understanding the Surprising Rise in U.S. Inflation Data
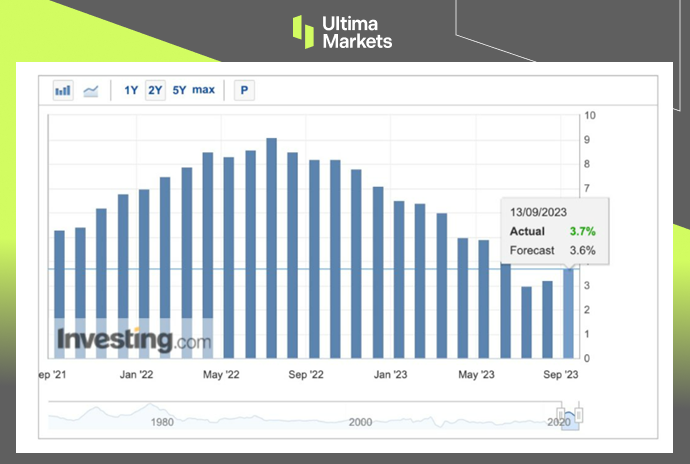
On September 13th, the U.S. Department of Labor (BLS) released the Consumer Price Index (CPI) in August increased by 3.7% year-on-year, slightly higher than the market estimate of 3.6%, and higher than the previous value of 3.2%.
However, excluding food and energy Core CPI increased by 4.3% YoY, in line with market expectations and lower than the previous value of 4.7%. It was the smallest increase in the past two years, but it was still higher than the Fed’s 2% target.
(U.S. Consumer Price Index CPI)
Understanding the Drivers
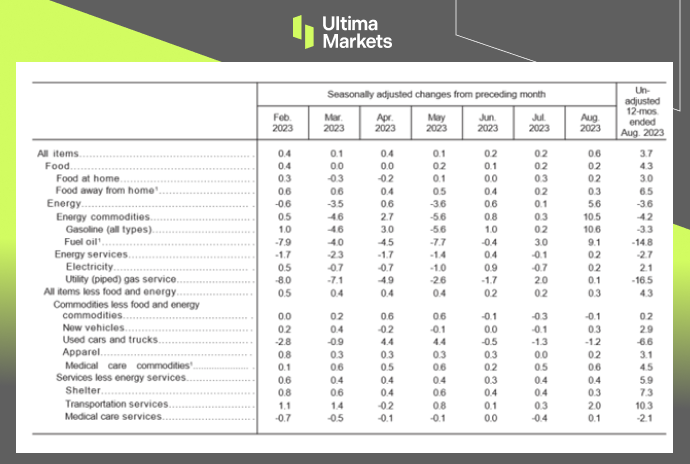
Examining the report details, energy was the main driver for the growth of CPI in August, accounting for more than half of the CPI increase. On a monthly basis, the growth rate of 5.6% was much higher than the 0.1% growth rate last month.
Separately, on an annual basis, housing prices increased by 7.3% in August, accounting for more than 70% of core CPI. However, the housing inflation rate is falling sharply, and the slowdown in growth has become more obvious.
In August, transportation (10.3%) beat housing for the first time and became the biggest driver of core CPI.
The production cuts by OPEC+ and the threat of strikes by the United Auto Workers against General Motors, Ford and Stellantis are all creating variables in the fight against inflation.
Implications for Monetary Policy
This CPI report is the last important economic data to be seen before the Fed’s monetary policy meeting next week.
CME Group The FedWatch Tool shows that the interest rate futures market predicts a 97% chance of keeping interest rates unchanged next week and only a 3% chance of raising interest rates by 25 bps.
However, the chances of keeping interest rates unchanged and raising interest rates by 1% at the November meeting are respectively 60% and nearly 40%.
(Detailed classification MoM % & YoY%, US BUREAU OF LABOR STATISTICS )
Conclusion
In summary, the unanticipated rise in U.S. inflation data for August 2023 raises critical questions and concerns.
As we explore the drivers behind this increase and the potential impact on monetary policy, it is evident that the economic landscape is evolving rapidly.
Market participants and policymakers must remain vigilant and adaptable in the face of dynamic conditions.
The coming months promise to be pivotal as we witness the Federal Reserve’s response to these unforeseen developments and their broader economic implications.
Disclaimer
Comments, news, research, analysis, price, and all information contained in the article only serve as general information for readers and do not suggest any advice. Ultima Markets has taken reasonable measures to provide up-to-date information, but cannot guarantee accuracy, and may modify without notice. Ultima Markets will not be responsible for any loss incurred due to the application of the information provided.
Written on September 14, 2023 at 3:45 am, by mervin
Comments Off on The Surprising Rise in U.S. Inflation Data for August 2023
Fundamentally, Traders will pay more attention to European Central Bank interest rate decision tonight. As the Eurozone’s second-quarter GDP growth rate dropped from 0.3% to 0.1%, the latest PMI data also showed that economic activity in the service industry and manufacturing industry shrank intensified in August. The sluggish economy coupled with high inflation and the haze of stagflation make interest rate decision of the European Central Bank full of suspense. If the European Central Bank chooses to pause interest rate hikes for the first time in this year, without additional hawkish comments, the euro may fall further against the dollar.
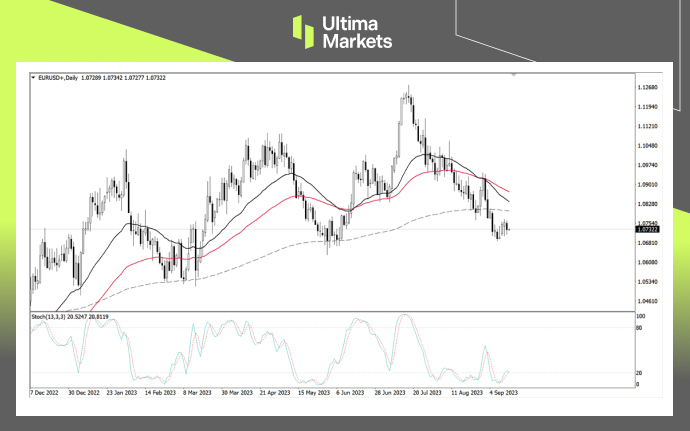
Technically, the euro’s short trend has temporarily gained the upper hand on daily chart. The 200-day moving average has been exceeded, the exchange rate is completely below the 200-day moving average, and the 33-day moving average and the 65-day moving average have also formed a dead cross downward.
( Daily chart of EUR/USD, source: Ultima Markets MT4)
It is worth noting that when the short-term moving average group is close to the 200-day moving average, the market is likely to fluctuate. A complete short trend requires waiting for the short-term moving average group to fall below the 200-day moving average as well. Therefore, although the market started to rise this week, it is currently judged to be a rebound, and the rebound is weak.
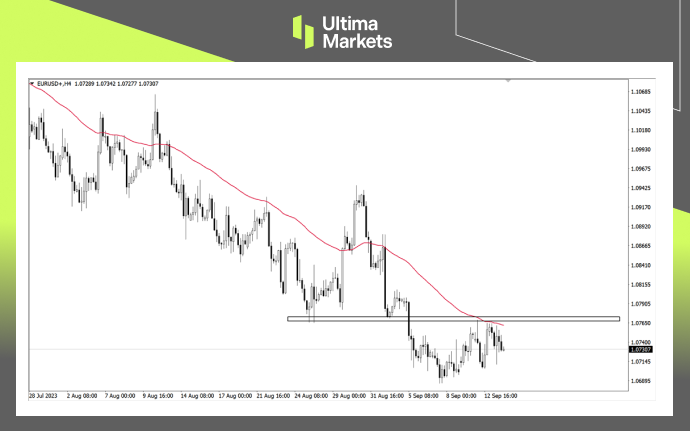
(4-hour chart of EUR/USD, source: Ultima Markets MT4)
On the 4-hour chart, the overlap between 1.07665 and the 65-period moving average is a strong resistance area, and the market failed to break through twice. Before the market completely rises above this resistance, the power of shorts will always be slightly stronger than that of bulls.
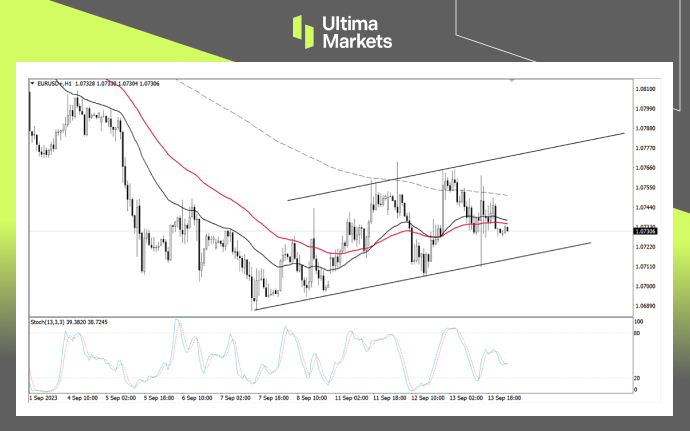
(1-hour chart of EUR/USD, source: Ultima Markets MT4)
On the 1-hour chart, the flag-shaped area is still in progress. For trading opportunities, traders need to wait for the signal of the stochastic oscillator, or the market falls below the previous low.
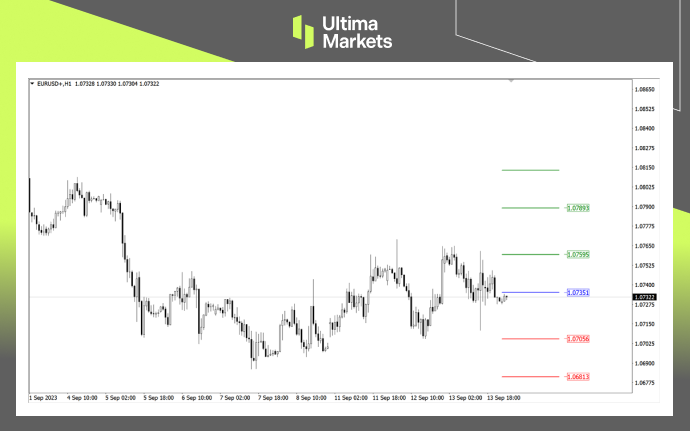
(1-hour chart of EUR/USD, source: Ultima Markets MT4)
According to the pivot indicator in Ultima Markets MT4, the central price of the day was 1.07351.
Bullish above 1.07351, first target 1.07595, second target 1.07893
Bearish below 1.07351, first target is 1.07056, second target is 1.06813
Disclaimer
Comments, news, research, analysis, prices and other information contained in this article can only be regarded as general market information, provided only to help readers understand the market situation, and do not constitute investment advice. Ultima Markets will not be responsible for any loss or loss (including but not limited to any loss of profits) that may arise from the direct or indirect use or reliance on such information.
Written on September 14, 2023 at 3:17 am, by mervin
As a mouthpiece of the Fed, the Jackson Hole Economic Symposium always attracts the eyeballs of numerous investors. Considering the current turbulent global economic situation, this year’s meeting is undoubtedly eye-catching. The three-day symposium officially ended in August, and the speeches of renowned financial names captured the world’s attention.
This article is going to unriddle hidden messages in speeches and help you get insight into future investment trends.
Fed message iterated and no rate cuts in sight
The spotlight at the meeting was the speech by Federal Reserve Chairman Jerome Powell. He patiently reiterated the importance of U.S. interest rate decisions on inflation: “The Federal Reserve’s responsibility is to reduce inflation to the 2% target. Although inflation has fallen from highs, it is considered too steep. The Fed will be prepared to raise interest rates further if necessary and keep restrictive policies going until it is confident that inflation will fall sustainably toward the target. ” From the words, the Fed still attaches great importance to achieving the inflation target, and it also greatly dispels market expectations for interest rate cuts.
Inflation downtrend becoming stagnant
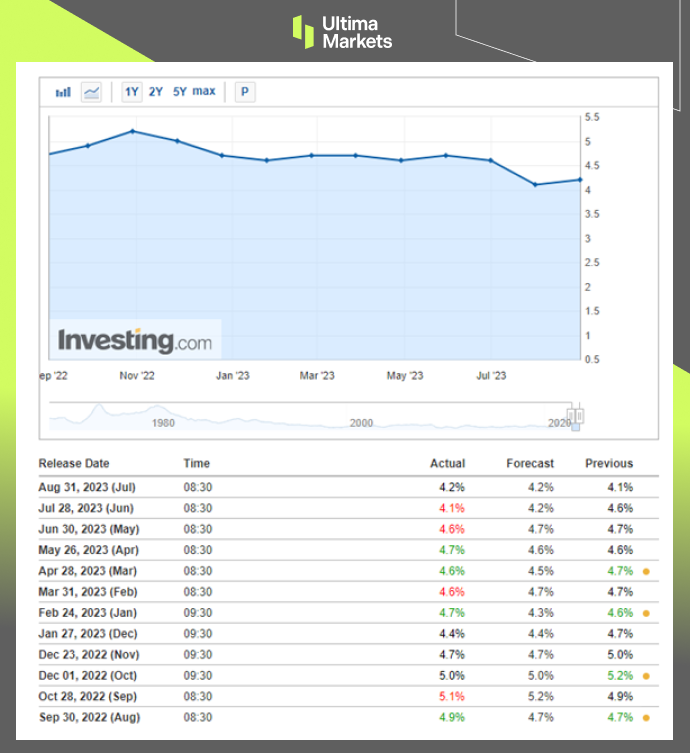
Judging from the figures released, although the economy has slowed down somewhat, consumption seemingly remains intact. After falling from highs, price levels have entered a stagnant state. This phenomenon will undoubtedly arouse market concerns in the high-interest rate environment. The U.S. Department of Commerce reported on July 28th that the personal consumption expenditures (PCE) index increased by 3.0% year-on-year in June, slightly lower than market expectations of 3.1%. Food and energy prices are susceptible to fluctuations due to global factors, which may send misleading signals to the inflation outlook. Therefore, the Fed focuses more on core PCE inflation. Excluding food and energy prices, core PCE increased by 4.1% year-on-year in June, which was lower than market expectations of 4.2% and 4.6% of the previous value, the smallest increase since September 2021. The U.S. Department of Commerce announced on August 31 that PCE increased by 3.3% annually in July, in line with market expectations. The core PCE increased by 4.2% year-on-year in July, slightly higher than the 4.1% in June, but in line with market expectations.
(Core Personal Consumption Expenditure PCE Index, Investing.com)
Resilient labor market
In addition, the job market continues to remain resilient, indicating that the U.S. economy not heading for a recession. However, inflation seems to be difficult to decline further as a result. The U.S. Department of Labor announced that nonfarm payroll increased by 187,000 in July, slightly lower than market estimates of 200,000. Although the number missed expectations, it actually went up from the downward revision of 185,000 in June. The unemployment rate was 3.5%, while the market consensus expected the unemployment rate to remain stable at 3.6%. The unemployment rate is slightly higher than the lowest level since late 1969. The average hourly wages, the Fed’s compass for inflation, rose 0.4% for the month and at an annual rate of 4.4%. Both figures were 0.3% and 4.2% higher than their respective forecasts.
Consult history when observing reality, Reality does not exist without history
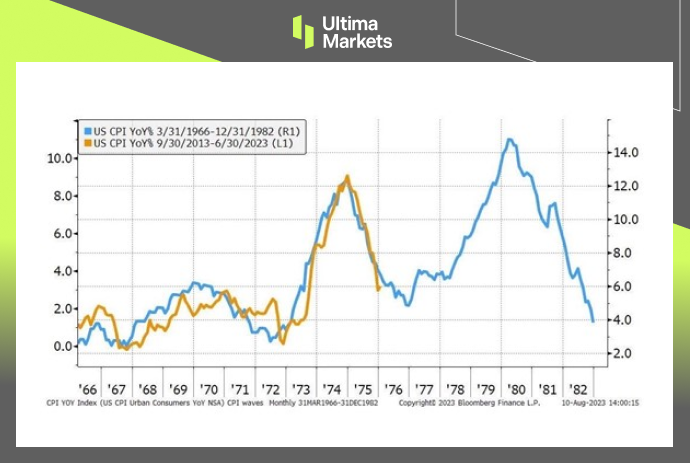
As we look for today’s answer from history, it is not difficult to discover the Fed’s concerns and why the chairman often adopts a reserved tone in his remarks. The long-run quantitative easing policy has made people accustomed to the low-interest environment. How did people deal with inflation? Is there a period in history that matches the present so that we can find clues? From the comparison of the diagram below, we can see that the yellow curve, representing CPI from 2013 to 2023, closely replicates the one dated 1966 to 1976 (blue line), with inflation rising sharply and then cooling down after being controlled. When the time sequence entered the late 1970s, the revolution in Iran caused tension in the oil market, and inflation soon reignited. The international crude oil price soared from about $15 per barrel in 1979 to doubling to $ 39 in February 1981. Price levels went skyrocketed. The late 70s CPI soared higher than the peak in 1974-75! Now, OPEC+ allies are implementing a voluntary production reduction policy until the end of the year in an attempt to deepen their operations in the oil market. As expected, oil prices have reached the year-to-date high of $90 per barrel at the beginning of autumn. Although economic data show inflation has cooled, history tells us it is hard to defeat. The oil cuts have fostered uncertainties on the path to winning the inflation battle. The Federal Reserve must stay alert and respond fast. Whenever there is an overly optimistic atmosphere in the market, the Federal Reserve will release a hawkish message to suppress it, conveying that interest rates must remain high and last longer. Its verbal warning works best when the global economic environment is fragile.
(US CPI YoY%, 1966-1982 Blue Line V.S. 2013-2023 Yellow Line)
Natural rate of interest possibly rises over time
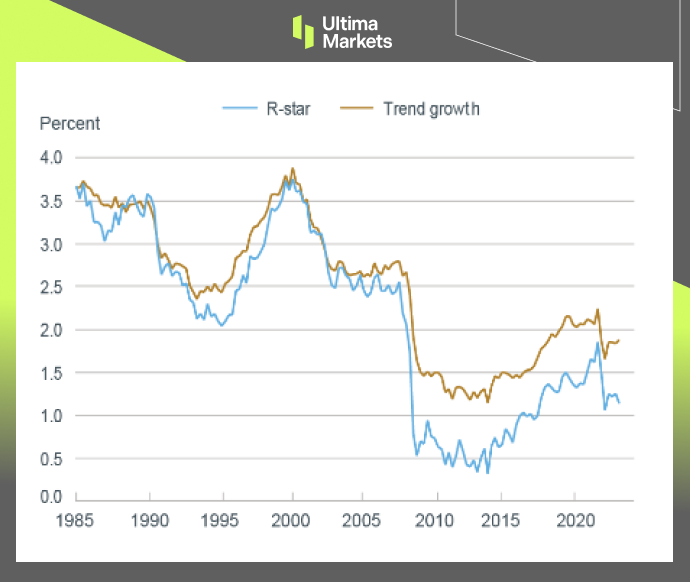
The natural rate of interest (r-star) has recently become a popularly debated topic among Fed officials, and some officials believe the neutral rate of interest might have gone up. The r-star is the real interest rate set by the central bank to keep the economy operating at full employment and price stability. Simply saying, at the neutral interest rate, the economy is neither expanding nor contracting. According to data from the Federal Reserve Bank of New York, r-star has been between 2.0% and 3.5% from 2000 to 2009 and remained near 1.0% since then. The Federal Reserve Bank of New York estimates that the current r-star hovers between 0% and 0.5%. Without the monetary easing policy, the U.S. economy seems to be intact and still running well in a relatively high interest-rate environment. Does this mean that the neutral interest rate has already quietly rebounded? However, the neutral interest rate has always been an abstract observation tool, which is not easy to measure and can only be reviewed after the fact occurs. With the uprise of the new economy and geopolitical risks, the Federal Reserve’s mission has become more complex, and monetary policy must become innovative and not limited to interest rate setting. What is certain is that the market’s desire to return to the ultra-low interest times of the past no longer exists.
(Natural rate of interest r-star, Fed NY)
Summary
As Powell said, the Fed still needs to work harder to bring inflation down to 2% sustainably, and this may require two conditions: A period of low economic growth and a cooling labor market. Speaking of economic growth, GDP growth in 1H23 is higher than the long-term trend, and recent consumption data has also been particularly strong. As for the labor market, it has been rebalancing over the past year.
Therefore, monetary policy needs to remain flexible. It is expected that interest rates will be raised again in September or November, while the interest rate cut expected by the market may have to wait until the second half of 2024. According to FedWatch, CME Group’s interest rate forecast tool, after Jackson Hole, the probability that the Fed will not raise interest rates in September has risen to 88.5%. Certainly, we cannot rule out the possibility that unexpected situations may occur, resulting in the Fed eventually raising interest rates in September.
Disclaimer
The comments, news, research, analyses, prices, and all information contained in this article can only be regarded as general information and are provided only to help readers understand the market situation and do not constitute investment advice. Ultima Markets has taken reasonable steps to provide up-to-date information, but cannot guarantee the accuracy and may modify without notice. Ultima Markets will not be responsible for any loss incurred due to the application of the information provided.
Written on September 14, 2023 at 2:02 am, by mervin
Comments Off on What is the Fed’s Next Move After Jackson Hole?
The ECB Debate: Hawks vs. Doves – Charting a Path Through Uncertainty
Since July 2022, interest rates in the euro area have increased by 4.25 percentage points. But as signs of recession in the region become increasingly apparent, with annual price growth now at half its peak of 10.6%, disagreements have emerged within the ECB over the future direction of interest rates. Some officials prefer to adding 25 bps, while others want to suspend interest rate hikes.
At the end of the summer, indicators of manufacturing and services sectors in the eurozone pointed to a slowdown. Higher interest rates of 3.75%~ 4.50% restrict bank lending. In fact, on September 11, the European Commission lowered the euro zone’s growth outlook for 2023 from 1.1% to 0.8% due to shrinkage in Germany, the largest economy in the region.
A Diverging Path at ECB
Three aspects make ECB decision-making more difficult:
1. Core inflation remains high, and although it has slowed somewhat, it grew at 5.3% last month, well above the historical average. Annual wage increases uplift price pressures as the labor market appears tight, particularly in the services sector.
2. Rising oil prices due to production cuts by OPEC+ allies and strikes at Australian LNG plants have added more variables to the eurozone economy. Prices are likely to remain high for longer.
3. There are apparent differences among ECB officials. After inflation falls, the European Central Bank is more willing to convey a hawkish tendency. The European Central Bank has defied market expectations in the past. To regain its prestige, it will continue to emphasize its anti-inflation credibility.
Christine Lagarde’s Balancing Act
Regardless of the decision, European Central Bank President Christine Lagarde must firmly express the ECB’s commitment to achieving its inflation target and say that interest rate cuts are still a distant prospect. It is a difficult decision, but actions speak louder than words when it comes to getting the message across.
Conclusion: Christine Lagarde’s Crucial Role
In conclusion, the ongoing ECB debate between the hawks and doves underscores the intricate decision-making process central bankers must navigate amidst economic uncertainties.
With core inflation remaining elevated, oil price volatility adding another layer of complexity, and divergent perspectives within the ECB, President Christine Lagarde faces a formidable task.
She must effectively communicate the ECB’s dedication to achieving its inflation target and convey that interest rate cuts remain a distant prospect.
In this critical juncture, actions will speak louder than words in conveying the ECB’s stance to the public and the financial markets.
In light of the multifaceted challenges, the world watches with keen interest, as the ECB’s final decision carries profound implications for the eurozone’s economic landscape.
Disclaimer
Comments, news, research, analysis, price, and all information contained in the article only serve as general information for readers and do not suggest any advice. Ultima Markets has taken reasonable measures to provide up-to-date information, but cannot guarantee accuracy, and may modify without notice. Ultima Markets will not be responsible for any loss incurred due to the application of the information provided.
Written on September 13, 2023 at 3:53 am, by mervin
Comments Off on The Debate Between Hawks and Doves Heating up at ECB
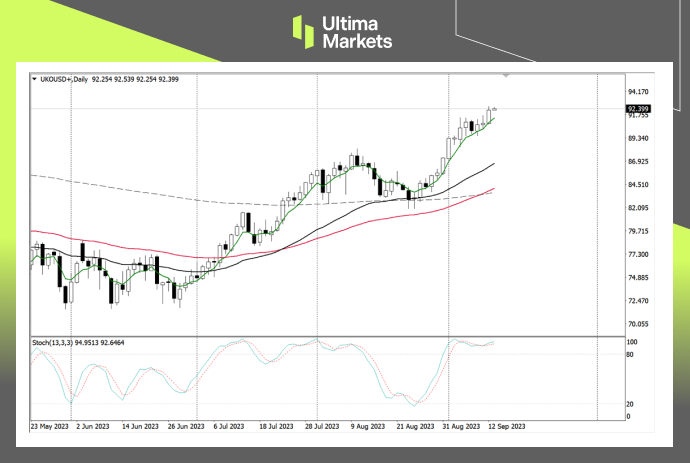
Fundamentally, with OPEC and EIA predicting that production cuts will tighten the market in the coming months, Brent crude oil has finally returned to above $90. The International Energy Agency will also release its monthly report today, which is expected to provide more clues to market conditions. The market focuses on whether the report also emphasizes that crude oil production will tighten supply for the rest of this year.
Technically, the stochastic oscillation in daily chart has once again risen with a golden cross, indicating the arrival of bulls. The moving average group also raised their heads to support the market’s further upward trend.
( Daily chart of Brent Oil, source: Ultima Markets MT4)
There is currently no moving average suppression above crude oil, and there is little resistance for bulls. Although the current signal of the stochastic oscillator occurs in the overbought area, judging from the chart, even if the market declines again, it will still have the support of the moving average group.
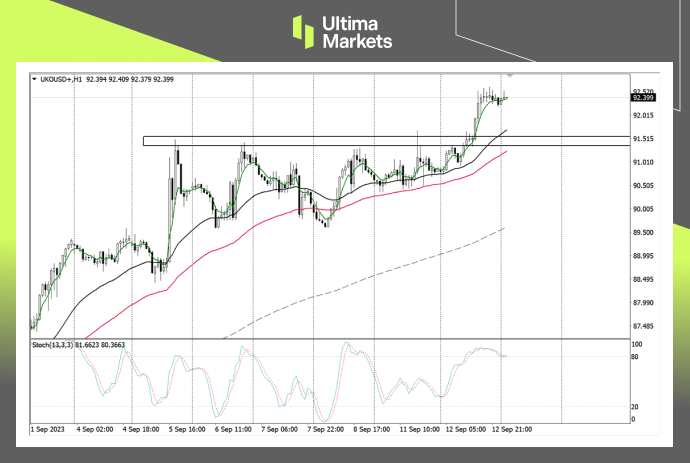
(1-hour chart of Brent Oil, source: Ultima Markets MT4)
On the 1-hour period, crude oil finally broke through resistance and moved upward yesterday after oscillating for nearly 5 trading days. At present, the stochastic oscillator crosses downwards, and the market has a potential adjustment probability in the Asian market. Priority is given to the resistance level for breakthroughs. After waiting for the stochastic oscillator to cross again, traders can pay attention to the long entry opportunities.
(1-hour chart of Brent Oil, source: Ultima Markets MT4)
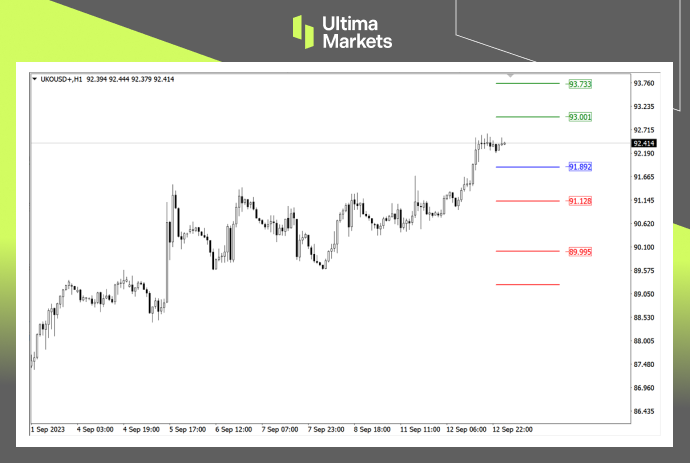
According to the pivot indicator in Ultima Markets MT4, the central price of the day was 91.892.
Bullish above 91.892, first target 93.001, second target 93.733
Bearish below 91.892, first target is 91.128, second target is 89.995
Disclaimer
Comments, news, research, analysis, prices and other information contained in this article can only be regarded as general market information, provided only to help readers understand the market situation, and do not constitute investment advice. Ultima Markets will not be responsible for any loss or loss (including but not limited to any loss of profits) that may arise from the direct or indirect use or reliance on such information.
Written on September 13, 2023 at 3:42 am, by mervin
Deciphering the Decline in S&P 500 Companies Citing “Inflation” in 2Q23 Conference Calls
Through Document Search, FactSet searched for the term “inflation” in the conference call transcripts of all the S&P 500 companies that conducted earnings conference calls from June 15 through September 7.
The Numerical Dip in S&P 500
Of these companies, 296 cited the term “inflation” during their earnings calls for the second quarter. This is the lowest number of S&P 500 companies citing “inflation” on earnings calls going back to Q2 2021 (221). It also marks the fourth consecutive quarter in which the number of S&P 500 companies citing the term “inflation” has declined quarter-over-quarter.
However, it should be noted that the number of S&P 500 companies citing “inflation” on earnings calls for Q2 2023 is still well above the 5-year average of 217 and the 10-year average of 168.
Sectoral Insights in S&P 500
At the sector level, the Financials (49) and Industrials (46) sectors have the highest number of companies that cited “inflation” on earnings calls for Q2. However, the Consumer Staples (86%), Consumer Discretionary (76%), and Materials (76%) sectors have the highest percentages of companies that cited “inflation” on their Q2 earnings calls during this period.
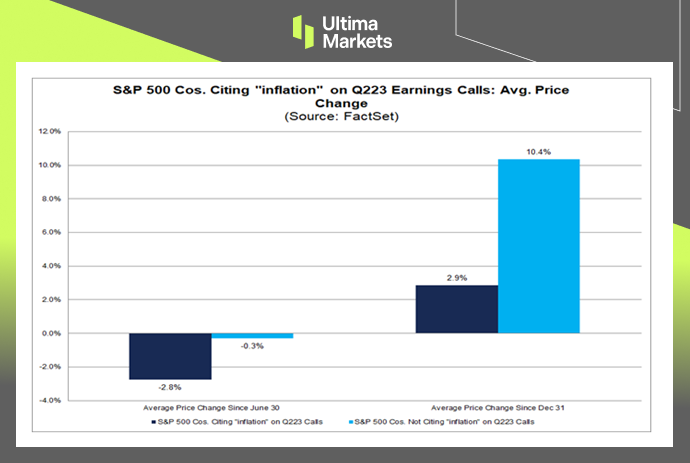
Impact on Stock Performance in S&P 500 Companies
It is interesting to note that S&P 500 companies that cited “inflation” on Q2 earnings calls have seen a weaker average stock price performance in recent months compared to S&P 500 companies that did not cite “inflation” on Q2 earnings calls.
For S&P 500 companies that cited “inflation” on Q2 earnings calls, the average change in price since June 30 is -2.8% and the average change in price since December 31 is 2.9%. For S&P 500 companies that did not cite “inflation” on Q2 earnings calls, the average change in price since June 30 is -0.3% and the average change in price since December 31 is 10.4%.
(Survey by FactSet)
Conclusion
In conclusion, while the decline in the number of S&P 500 companies referencing “inflation” in their earnings calls is noteworthy, it’s crucial to view these statistics within the broader context.
The relative high numbers compared to historical averages indicate that the topic remains relevant. Additionally, the varying stock performance for companies mentioning “inflation” presents a compelling puzzle for investors and analysts alike.
As the financial landscape continues to evolve, it is imperative to closely monitor these trends to make informed investment decisions.
Disclaimer
Comments, news, research, analysis, price, and all information contained in the article only serve as general information for readers and do not suggest any advice. Ultima Markets has taken reasonable measures to provide up-to-date information, but cannot guarantee accuracy, and may modify without notice. Ultima Markets will not be responsible for any loss incurred due to the application of the information provided.
Written on September 12, 2023 at 3:37 am, by mervin
Comments Off on Fewer S&P 500 Companies Citing “Inflation” in 2Q23 Conference Calls