Comprehensive USD/CAD Analysis For October 5, 2023
In this comprehensive analysis, Ultima Markets brings you an insightful breakdown of the USD/CAD for 5th October 2023.
Key Takeaways
- U.S. Economic Data: The release of subpar U.S. economic data acted as a catalyst for market movements. This data sent shockwaves through the forex market, causing traders to react by selling off the U.S. dollar.
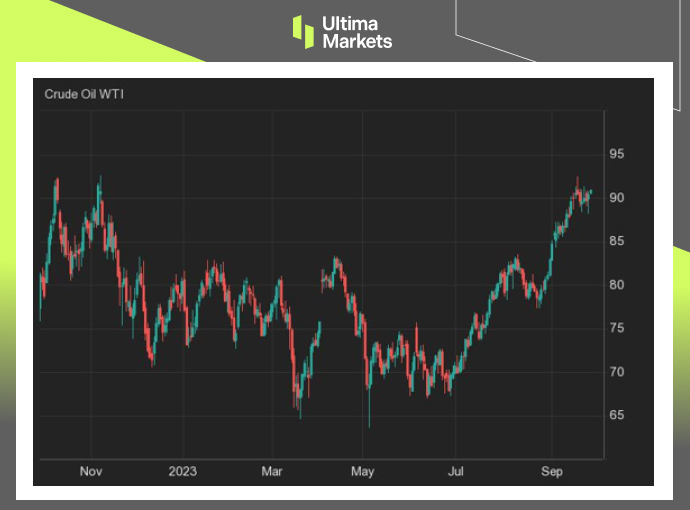
- Crude Oil Market: Another significant factor was the impending destruction of crude oil demand. This development, coupled with the gloomy macroeconomic outlook, played a substantial role in shaping the forex landscape. As crude oil prices began to fall, the depreciation of currencies in energy-exporting countries gained momentum.
- Canadian Dollar’s Depreciation: The Canadian dollar, in particular, saw a short-term depreciation trend that intensified due to the interplay of these factors.
USD/CAD Technical Analysis
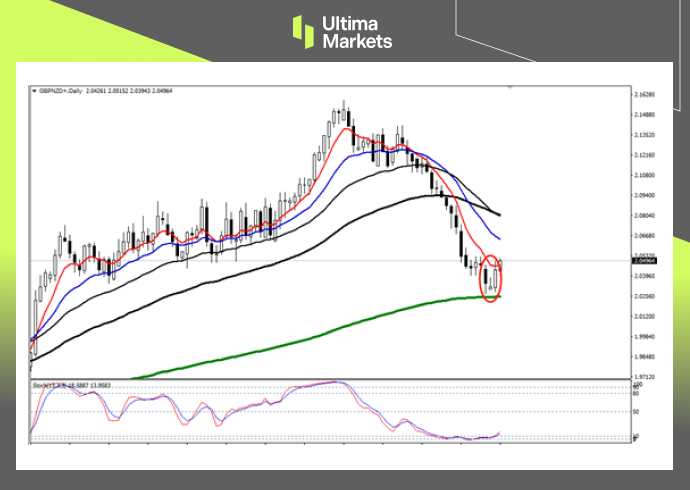
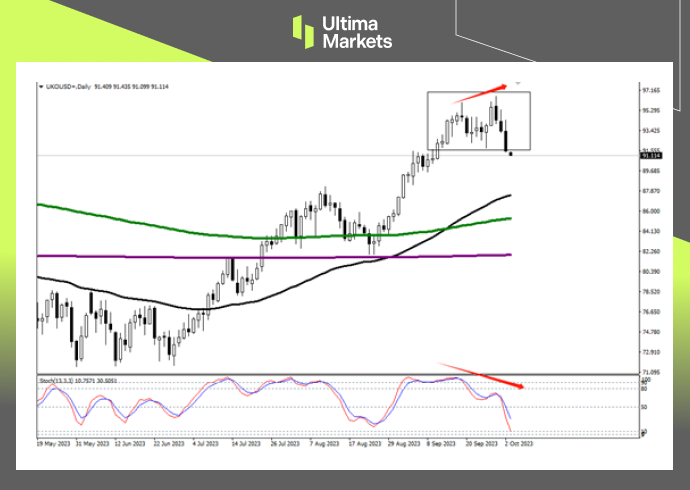
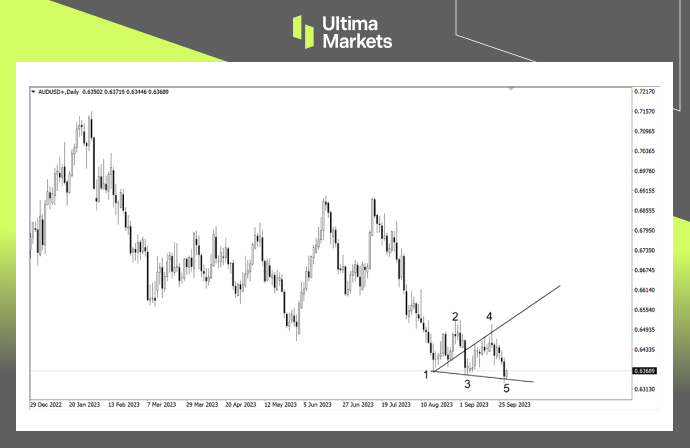
USD/CAD Weekly Chart
The weekly chart of USD/CAD in October 2023 revealed a pivotal development. The closing line for the week was on the verge of breaking through the suppression of the downward trend line, which had been in place since October of the previous year. Furthermore, the stochastic oscillator was on the cusp of reaffirming the upward trend.
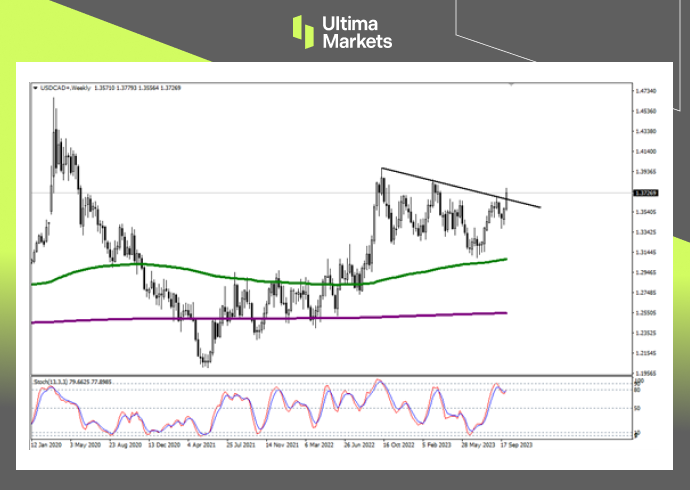
(Weekly chart of USD/CAD, source: Ultima Markets MT4)
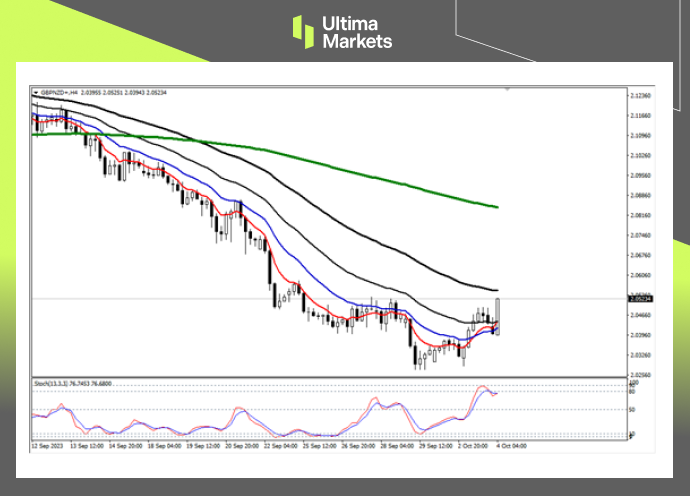
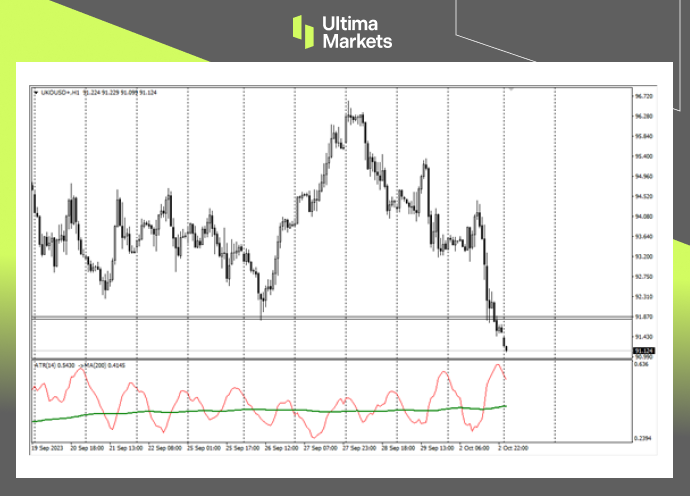
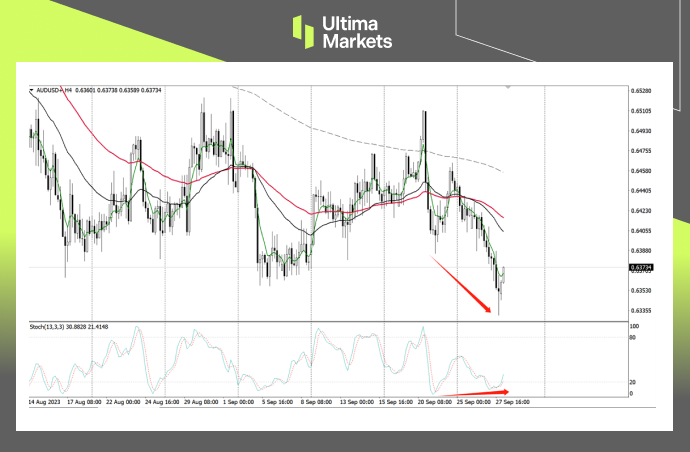
USD/CAD 4-Hour Chart Analysis
Zooming in on the 4-hour chart, we identified a weakening of prices following the recent breach of the weekly downward trend line. The stochastic oscillator displayed a divergent downward trend, indicating that the exchange rate was likely entering an adjustment cycle.
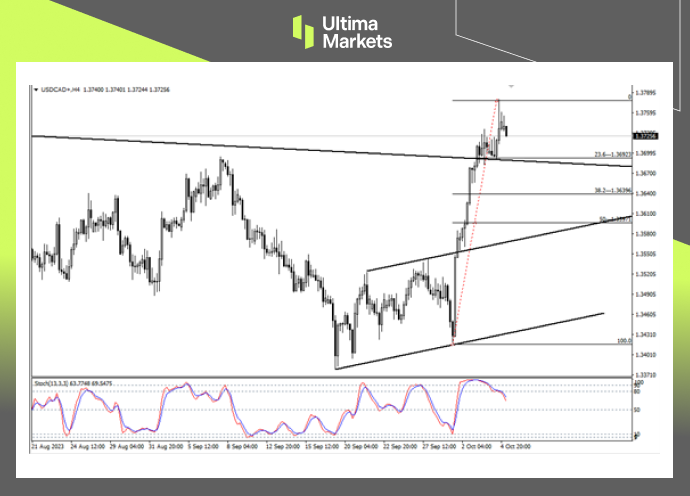
(4-hour chart of USD/CAD, source: Ultima Markets MT4)
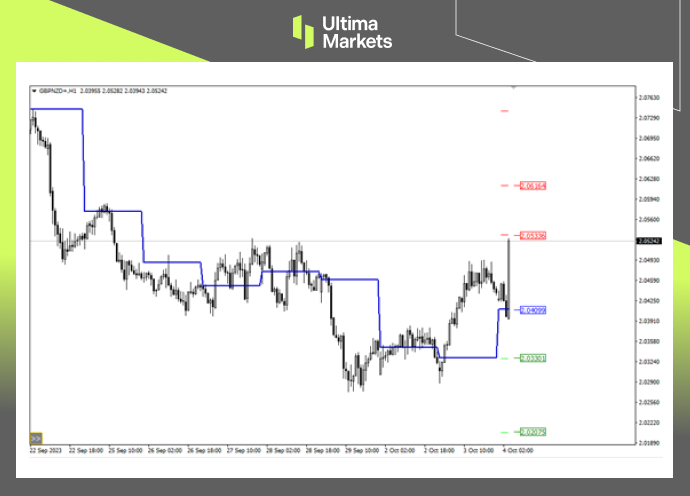
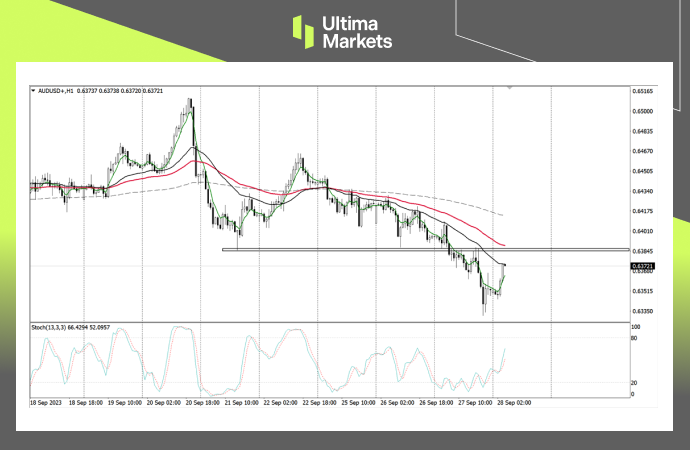
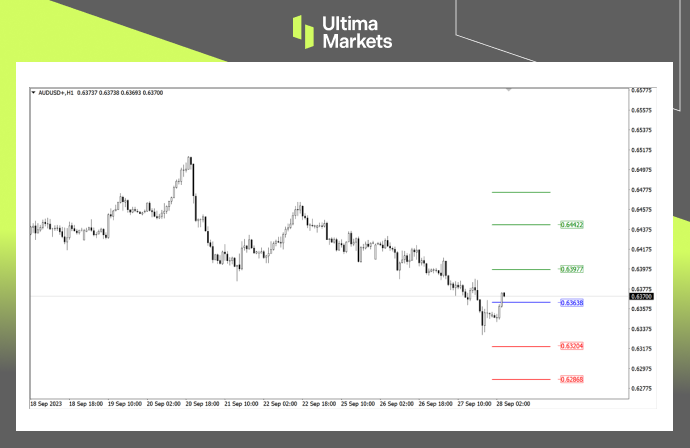
USD/CAD 1-Hour Chart Insights
On the 1-hour chart, the 23.6% retracement level at 1.36923 emerged as an extremely critical support price. This level could potentially mark the end of the downward trend. Conversely, falling below this level would signify a breach of the weekly downward trend line, casting doubts on the legitimacy of the recent upward trend.
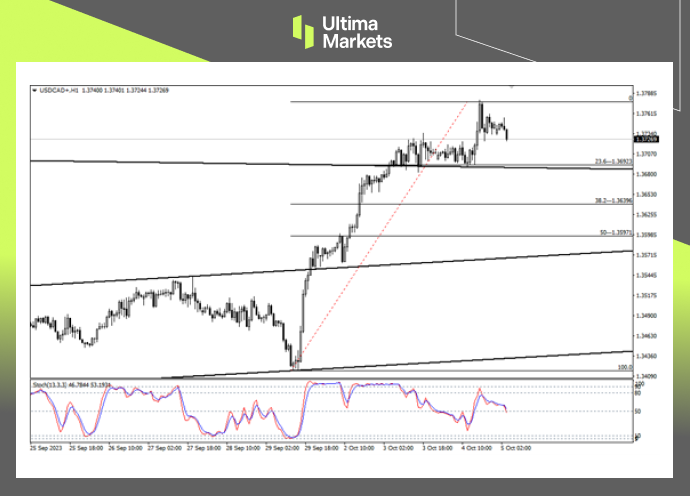
(1-hour chart of USD/CAD, source: Ultima Markets MT4)
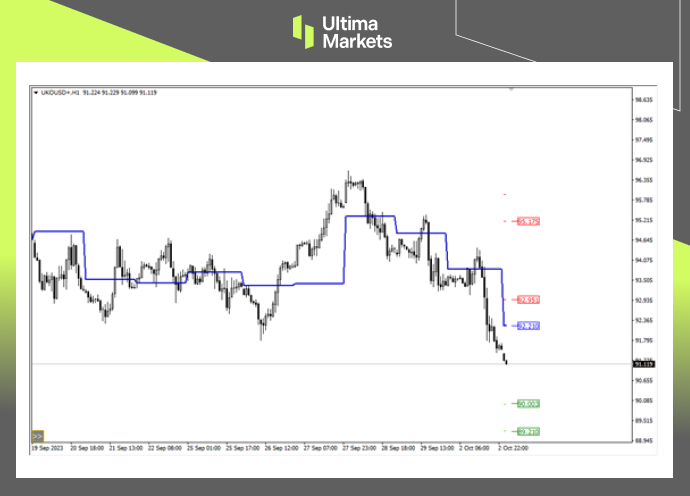
USD/CAD Pivot Indicator
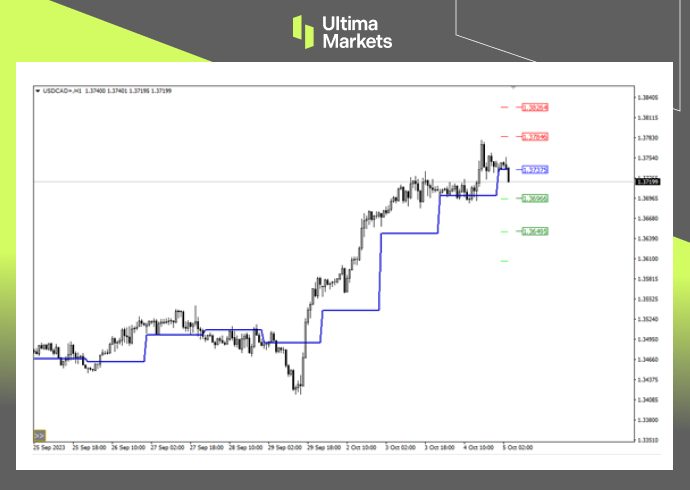
(1-hour chart of USD/CAD, source: Ultima Markets MT4)
According to the pivot indicator in Ultima Markets MT4, the central price of the day was 1.37375.
- Bullish above 1.37375, the first target is 1.37846, the second target is 1.38264
- Bearish below 1.37375, first target 1.36966, second target 1.36495
Conclusion
In conclusion, October 2023 brought about a series of significant fundamental and technical developments in the USD/CAD forex market. Traders were faced with key decision points, influenced by a variety of factors, from U.S. economic data to crude oil prices.
The forex market remains inherently volatile, emphasizing the importance of informed, strategic, and responsive trading decisions.
At Ultima Markets, we are committed to providing valuable market insights to empower your trading decisions.
While this article offers a comprehensive overview of the USD/CAD situation in October 2023, it’s essential to keep a watchful eye on market developments and continue refining your trading strategies to stay ahead in the competitive world of forex trading.
Legal Documents
Ultima Markets, a trading name of Ultima Markets Ltd, is authorized and regulated by the Financial Services Commission “FSC” of Mauritius as an Investment Dealer (Full-Service Dealer, excluding Underwriting) (license No. GB 23201593). The registered office address: 2nd Floor, The Catalyst, 40 Silicon Avenue, Ebene Cybercity, 72201, Mauritius.
Disclaimer
Comments, news, research, analysis, price, and all information contained in the article only serve as general information for readers and do not suggest any advice. Ultima Markets has taken reasonable measures to provide up-to-date information, but cannot guarantee accuracy, and may modify without notice. Ultima Markets will not be responsible for any loss incurred due to the application of the information provided.
Copyright © 2023 Ultima Markets Ltd. All rights reserved.