If you have read our article “Basic Types of Charts in Technical Analysis”, now it’s time to unlock the secret with technical analysis indicators. Let’s dive in!
Moving Averages:
Moving averages calculate the average price of a currency pair or any other asset over a specific period, such as 10 days or 50 days, to reveal the trend. By plotting these averages on a chart, you can easily spot if prices are going up or down. They help you identify potential buy or sell signals to make trading decisions like a pro!
Relative Strength Index (RSI):
RSI helps you measure the strength and momentum in the markets. This oscillator ranges from 0 to 100. When it goes above 70, it suggests the asset might be overbought. On the contrary, when it drops below 30, it indicates the asset might be oversold.
Bollinger Bands:
Bollinger bands are like dynamic rubber bands hugging the price chart. They consist of a moving average line in the middle, with two bands above and below, representing standard deviations from the average. When the price moves close to the bands, it could mean a surge in volatility. Bollinger Bands are perfect for identifying potential price breakouts or reversals so that you won’t miss those exciting trading moments!
Summary
You can combine these indicators to build your trading superpower! For example, you might use moving averages to spot trends, RSI to identify overbought or oversold conditions, and Bollinger Bands to confirm potential breakouts. The possibilities are endless, and by blending different indicators, you can develop your own unique trading strategy.
Technical analysis in forex trading is like solving a puzzle using historical price data. It helps us understand the past and make predictions about the future.
What is Technical Analysis?
By studying these puzzle pieces—patterns, trends, support and resistance, and using indicators—we can make predictions about future price movements. But remember, technical analysis is not foolproof. It’s like a game of probabilities, where we use historical clues to make educated guesses about what might happen next. It’s important to combine technical analysis with other forms of analysis, like understanding economic news and managing risks.
By learning technical analysis, people can develop a better understanding of how prices move in the forex market and use this knowledge to make more informed trading decisions. It’s like being a detective, solving puzzles and making predictions based on the clues we find in the charts. Just like any skill, practice and continuous learning are key to becoming better at technical analysis.
Key Components of Technical Analysis
As we mentioned above, traders rely on various clues from the past to predict the future. And here are some key clues frequently used to make predictions:
Price charts:
Price charts show the historical prices of a currency pair, like a line graph or candlestick chart. These charts display the ups and downs in currency prices over time.
Patterns and trends:
Traders look for patterns and trends in the price charts. They observe how prices have moved in the past to identify similar patterns that might happen in the future. For example, they might notice that every time the price goes up a certain amount, it tends to come back down, or vice versa. These patterns are used to predict when the price might go up or down next.
Indicators:
Traders use indicators, which are special calculations based on price data, to obtain more market information. For example, they might use moving averages, which show the average price over a certain period, to identify trends. They can also use oscillators, which help determine if a currency is overbought or oversold.
Summary
Traders can make predictions about future price movements by relying on technical analysis.
Technical analysis consists of many key components, such as price charts, patterns and trends, and indicators.
If you have read our article “Introduction to Technical Analysis”, then you must be aware of the significance of technical analysis, which is used by master traders to predict the ups and downs of the financial markets. In this article, we are going to lift the curtain on the myth of technical analysis: Charts!
Line charts:
Let’s start with the most beginner-friendly chart: the line chart. Line charts display the closing prices of a currency pair, stock, crypto, or any other type of financial asset, over a specific time frame, and these price dots are connected with a line.
This straightforward chart gives a clear picture of price movements, convenient for you to take a quick glance at the market’s overall trend.
Candlestick charts:
Candlestick charts are like little rectangles with wicks on top and bottom. These candles stand for price movements within a specific time period (maybe an hour or a day). The body of the candle indicates the opening and closing prices, while the wicks reveal the highest and lowest prices during that time. By taking advantage of candlestick charts, you can access more details about the magnitude of price movements.
Bar charts:
Bar charts resemble vertical lines with small dashes on each side. The top dash represents the highest price, the bottom dash the lowest price, and the vertical line the opening and closing prices. Sounds like candlestick charts? That’s right. Bar charts are just like cousins of candlestick charts, providing similar information with just a slightly different look.
Summary
Charts help us unravel patterns, trends, and potential price movements. By analyzing these charts, you can make reasonable predictions about where prices might head next, giving you a competitive edge in CFD trading. Charts are your trusty companions to embark on the thrilling journey of trading.
First things first, FOMC stands for the Federal Open Market Committee. Think of it as the mastermind behind the scenes, making decisions that can send shockwaves through the financial markets. In this article, we are going to walk you through the FOMC Meeting, and explain why it is a big deal for you.
Interest rate decision:
Imagine you are at an amusement park, and the FOMC is controlling the speed of the roller coaster. Interest rates are just like the gas pedal for the economy. When the FOMC decides to raise interest rate, borrowing money becomes more costly. This can cool down an overheated economy and tame inflation. On the other hand, when they lower interest rates, borrowing money becomes cheaper, thereby boosting spending and investment. These rate decisions can jolt the values of currency pairs, stocks, or commodities.
Market mood:
Experienced traders tend to analyze every word the FOMC utters during the meeting to predict what’s coming next. If the FOMC hints at rate hikes, traders might expect currency values to rise. If they signal rate cuts, stock prices might skyrocket. You may grab a competitive edge by hunting for clues from their statement.
Volatility swing:
FOMC meetings can feel just like a roller coaster. Currencies might leap, stocks can soar or plummet, and commodities might go on a wild ride. The thrilling volatility may catch inexperienced traders off guard. That’s why knowing when the FOMC is meeting and preparing for their announcements is a savvy move.
Summary
In a nutshell, FOMC decisions about interest rates will impact economies and market expectations, and send waves around the globe. For CFD traders, knowing these meetings and how they can shape the markets will give you an upper hand.
Fundamental factors are like puzzle pieces that shape the big picture of the financial world. These factors can influence the value of assets such as currency pairs, stocks, commodities, and even cryptos. In this article, we will uncover such key factors, which often create opportunities for intelligent investors and traders.
Geopolitical events:
Geopolitical factors like wars, elections, trade deals, or conflicts can cause ripples in the markets. Positive events can boost investor confidence, while negative news can trigger uncertainty. You are highly recommended to stay updated on global affairs to anticipate how they might impact your trades.
Economic indicators:
Economic indicators are like the scoreboard, showing the health of a country’s economy. When GDP (Gross Domestic Product) goes up, it’s a sign of economic strength. Low unemployment rates mean people have jobs and money to spend. Inflation, the rise in prices, affects consumers’ buying power. And interest rates set by central banks can make borrowing cheaper or pricier. These indicators affect market sentiment, and understanding them gives you an edge.
Corporate earnings:
Corporate earnings can reveal how well a company is doing. Strong earnings mean the company is making money, which can lead to higher stock prices. Keep an eye on quarterly reports and profit margins – they’re your insider’s ticket to predicting movements of stocks and indices.
Natural disaster or climate events:
Imagine you’re a scientist observing nature’s forces. Natural disasters like hurricanes, earthquakes, or droughts can disrupt supply chains and affect commodity prices. Climate events, like changing weather patterns, impact agricultural products. Keeping an eye on these factors helps you anticipate potential market shifts.
Market sentiment:
Imagine you’re a scientist observing nature’s forces. Natural disasters like hurricanes, earthquakes, or droughts can disrupt supply chains and affect commodity prices. Climate events, like changing weather patterns, impact agricultural products. Keeping an eye on these factors helps you anticipate potential market shifts.
Summary
By understanding fundamental factors, you can predict how the market might change. For example, if an economic indicator suggests a strong economy, you might expect stock prices to rise. If geopolitical tensions increase, currencies might fluctuate.
In a word, fundamental factors are the driving forces behind price movements. Understanding them will give you a competitive edge.
If you are eager to understand the magic behind the financial markets, look no further than fundamental analysis! It’s time to unlock this exciting aspect of CFD trading and show you how to take advantage of it like a pro.
What Is Fundamental Analysis?
Fundamental analysis is all about exploring the real factors that drive the prices of financial assets like currency pairs, stocks, commodities, or cryptos. Unlike technical analysis, fundamental analysis focuses on the big picture, considering economic, financial, and geopolitical factors that influence an asset’s value.
Key Factors in Fundamental Analysis
Geopolitical Events:
Geopolitical events, like elections, trade deals, or conflicts, can cause turbulence in the financial markets. They play a role in shaping investors’ confidence and affecting asset prices. Keep an eye on global news and how it impacts the markets.
Economic Indicators:
Economic indicators are like clues that help you understand the health of a country’s economy. Key indicators include GDP (Gross Domestic Product), employment rates, inflation, and interest rates. When these indicators show a strong economic signal, asset prices might rise. But if they reveal weakness, prices could fall.
Company Performance:
If you’re trading CFDs on individual stocks, it’s essential to investigate the companies behind them. Look into their financial reports, earnings, and growth prospects. A company with solid earnings and exciting projects may attract more investors, boosting its stock price. But beware of companies facing challenges, their stock prices might take a dip.
Summary
Fundamental analysis is key to revealing the hidden treasures of the financial markets. It can help you understand the true value of assets and the factors that drive their prices. By combining fundamental analysis with technical analysis, you will be well-equipped to tackle the thrilling world of CFD trading.
Fundamentally speaking, the US released retail sales in July increased by 0.7% mom. The figure for June was also revised up to 0.3% from 0.2%, suggesting the U.S. economy continued to expand in 3Q and avoid recession. Consequently, inflation stays still in the short run. With demand remaining resilient and labor market tightening, curbing inflation has become a tricky problem for the FED. We believe gold is heading for a bounce.
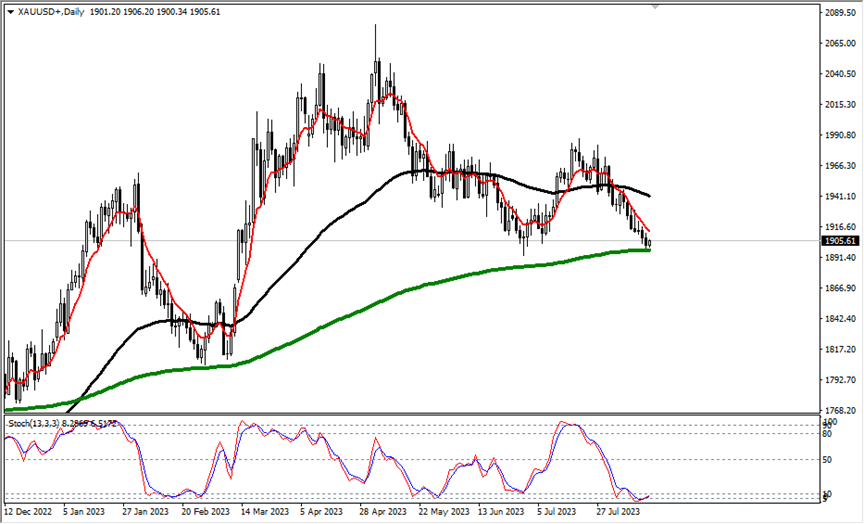
Technically speaking, the gold daily has come to a key support zone – the 240-day moving average .
(Gold daily cycle, Ultima Markets MT4)
The 240-day moving average has been a supportive position for gold since 2022. The gold price made small fluctuations in the supportive zone during the past week, nevertheless, the stochastic oscillator signaled a golden cross yesterday.
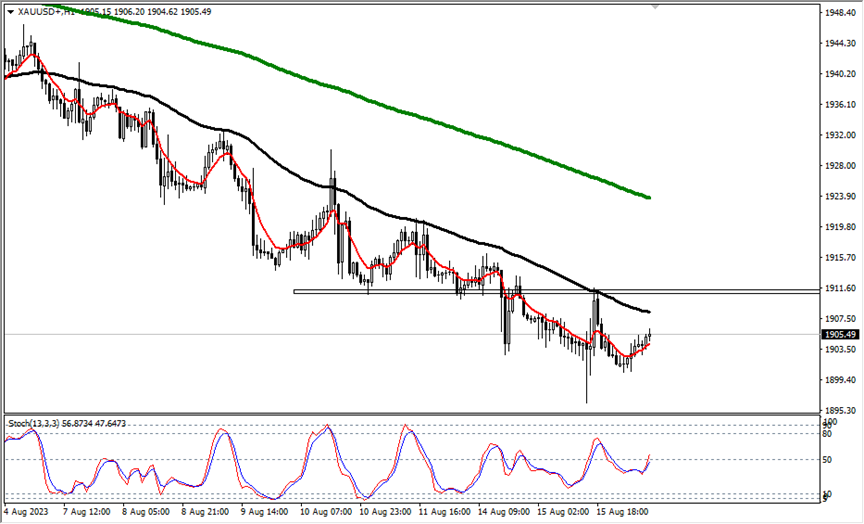
(Gold in 1- hour period, Ultima Markets MT4)
In 1-hour period, the gold price went down again after stepping back on the 65 – period moving average yesterday, but it did not fall below the previous low. Looking at the overall structure, the gold price has a probability of forming a bottom structure. After the price breaks through the previous suppressed position, please make sure if the ATR combination indicator shows an effective breakthrough.
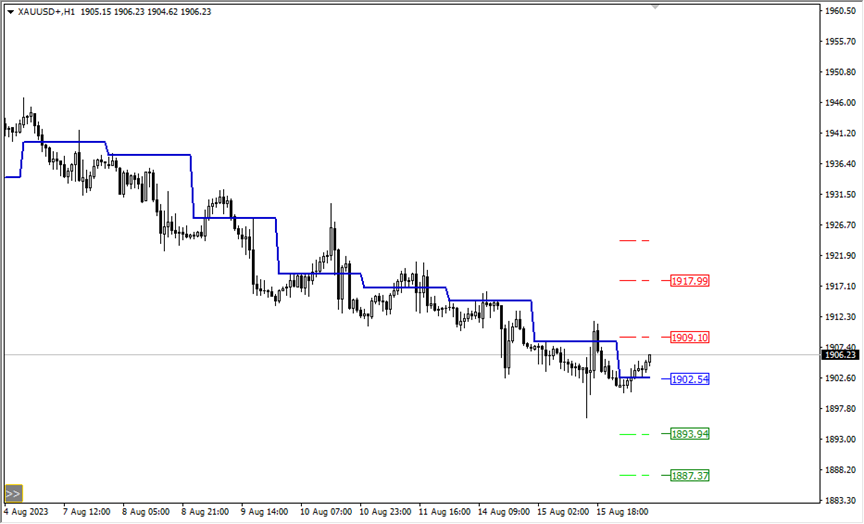
(Gold in 1- hour cycle, Ultima Markets MT4)
According to the pivot indicator in Ultima Markets MT4, the central price is 1902.54,
Bullish above 1902.54, the first target is 1909.10, and the second target 1917.99.
Bearish below 1902.54, the first target is 1893.94, and the second target 1887.37.
Disclaimer Comments, news, research, analysis, price, and all information contained in the article only serve as general information for readers and do not suggest any advice. Ultima Markets has taken reasonable measures to provide up-to-date information, but cannot guarantee accuracy, and may modify without notice. Ultima Markets will not be responsible for any loss incurred due to the application of the information provided.
Fundamentally speaking, although Fed’s rate hike coming to an end, the U.S. dollar index continues to rise. According to data released by the CFTC last week, the short positions fell to the lowest level in eight weeks. Short-covering is fueling a rebound in the U.S. dollar index as hedge funds continue to trim their short positions.
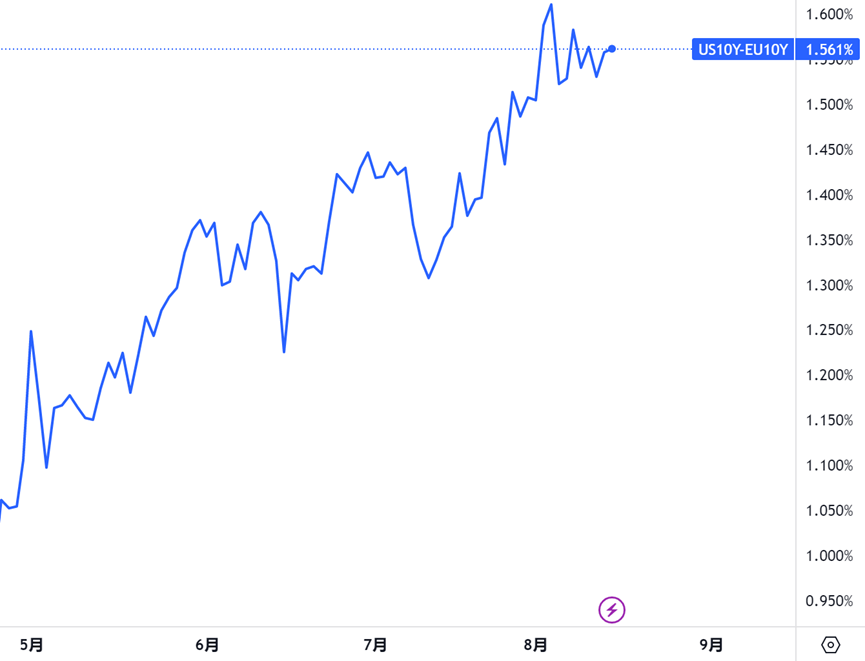
(US 10 -Year Treasury Yield vs EU 10 -Year Treasury Yield)
During the tightening monetary cycle, the spread of long-term bonds between the United States and Europe drives arbitrage funds to buy dollar and sell euro. In the short term, the spread deliveries adjustments to the exchange rate.
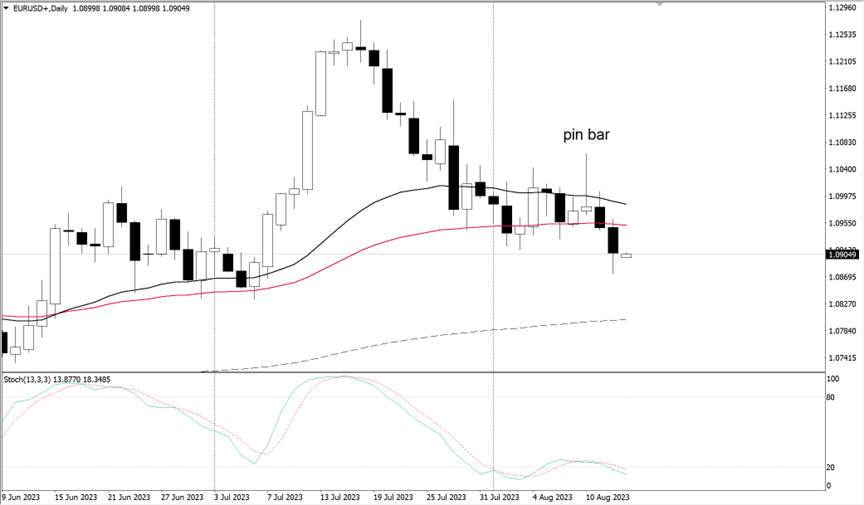
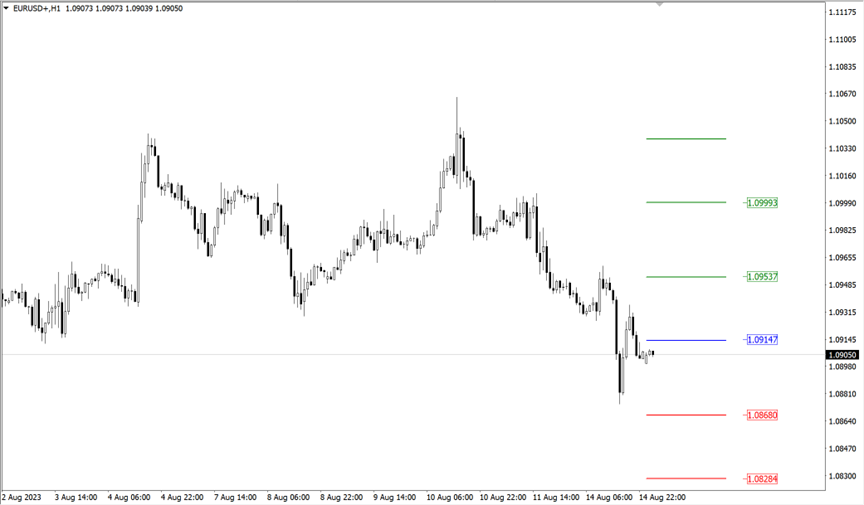
Technically speaking, the EUR/USD daily cycle completed a breakout of last Friday’s low yesterday. The market has a high probability of ushering in a downward trend in the next two days.
(EUR/USD daily cycle, Ultima Markets MT4)
The exchange rate fell below multiple moving averages and was blocked by the 61.8% golden ratio Fibonacci retracement position yesterday. Today there is a certain probability of stepping back on the moving average or consolidating prices, but if today’s market continues to fall below yesterday’s low, the euro will remain weak against the dollar.
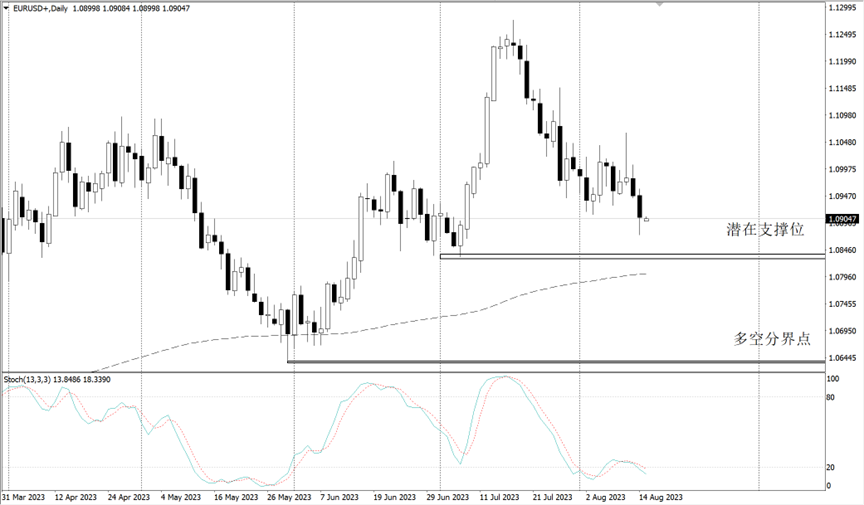
(EUR/USD daily cycle, Ultima Markets MT4 )
From the perspective of daily structure, there are two key support positions below the level, 1.0836 is the potential target, and 1.0639 is the extremely critical long-short boundary. If all supportive levels are crushed, a deep correction will come along.
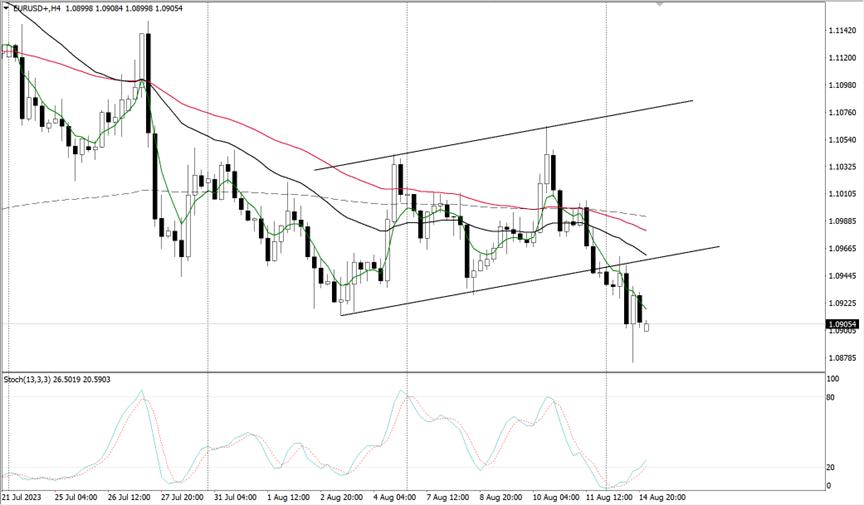
(EUR/USD in 4 -hour cycle, Ultima Markets MT4)
In 4- hour cycle, bull and bear are in entanglement. The Stochastic Oscillator displays a golden cross to indicate the bull, but the exchange rate maintains a downward trend. It means that the decline is not firm enough, and the rebound is still strong.
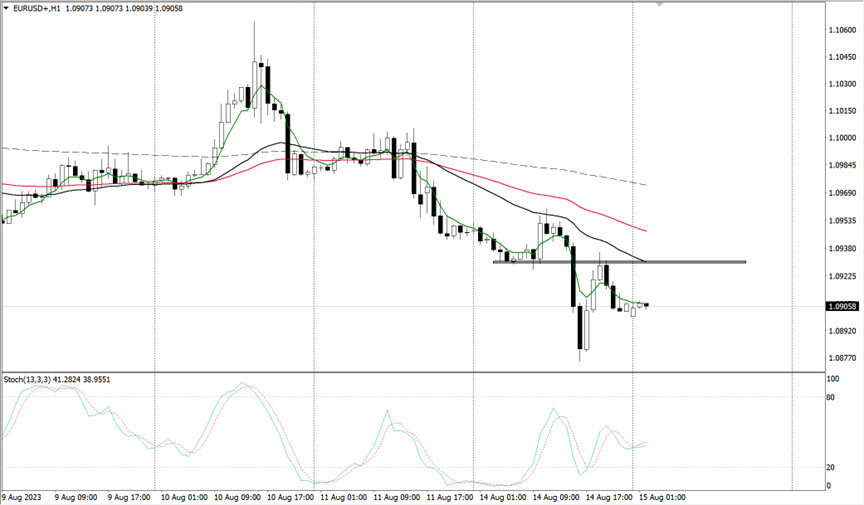
(EUR/USD in 1- hour cycle, Ultima Markets MT4)
In 1- hour cycle, the price still has the probability of stepping back on the moving average and resistance level. If Stochastic Oscillator shows a dead cross later on, please look for short trading opportunities.
According to the pivot indicator in Ultima Markets MT4, the central price is 1.09147,
Bullish above 1.09147, the first target is 1.09537, and the second target 1.09993.
Bearish below 1.09147, the first target is 1.08680, and the second target 1.08284.
Disclaimer
Comments, news, research, analysis, price, and all information contained in the article only serve as general information for readers and do not suggest any advice. Ultima Markets has taken reasonable measures to provide up-to-date information, but cannot guarantee accuracy, and may modify without notice. Ultima Markets will not be responsible for any loss incurred due to the application of the information provided.
RBNZ might hold rates unchanged while institutions short on NZD
The Federal Reserve Bank of New Zealand will announce the latest interest rate decision on Wednesday, and the market expects to keep the OCR official cash rate unchanged at 5.50%.
At the moment, global economics are cooling, while the figures released by RBNZ are not strong enough.
Consequently, RBNZ gains space to keep interest rates unchanged and time to observe the inflation situation further.
The Intricacies of the New Zealand Economy
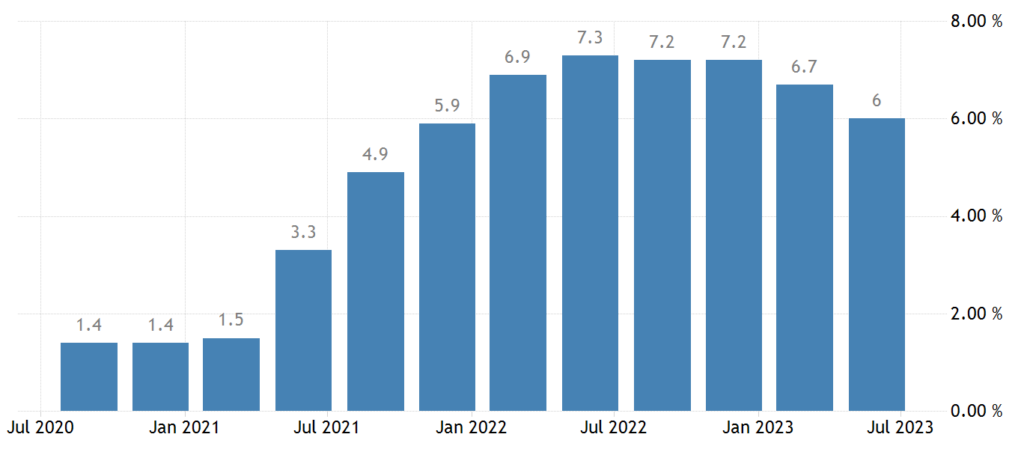
NZ economic data displays a mixed picture, with inflation data tapering off despite resilient demand, leaving investors conflicting signals. NZ economic conditions have not weakened as badly as previously expected.
(NZ inflation rates in one year)
Although inflation has started to fall, it has remained high. The strong labor market has prompted RBNZ to postpone an expected rate cut originally scheduled for the fourth quarter of 2023 until the second quarter of 2024.
The wage growth has declined, however, stayed at an elevated level, hampering RBNZ to reach its inflation goal. NZ’s GDP growth rate is expected to pick up slightly in 2023, showing some resilience in its economy.
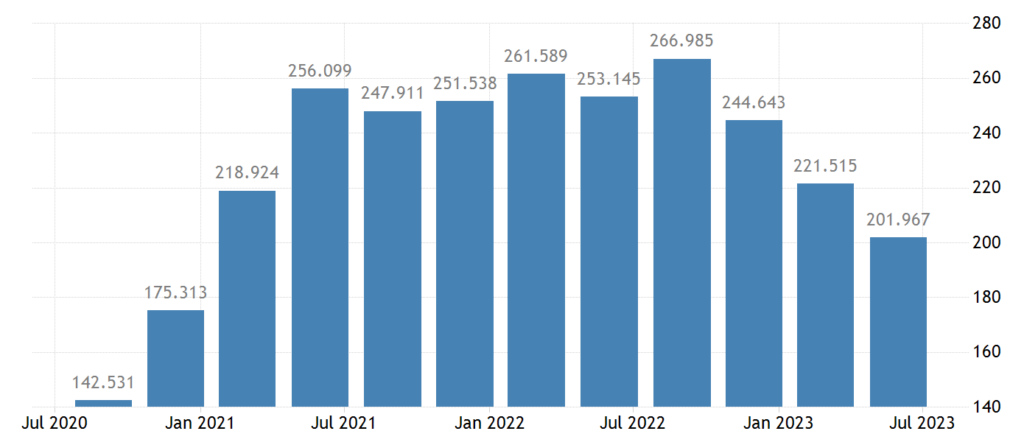
(NZ job vacancies decreased since July 2022)
The Uncertainty Surrounding OCR
A ‘watch, worry, and wait’ stance seems the most likely outcome of the OCR review. However, some institutions believe it is possible to see rates go up to 5.75% in the future. The divergence reflects market uncertainty toward inflation and the economic outlook.
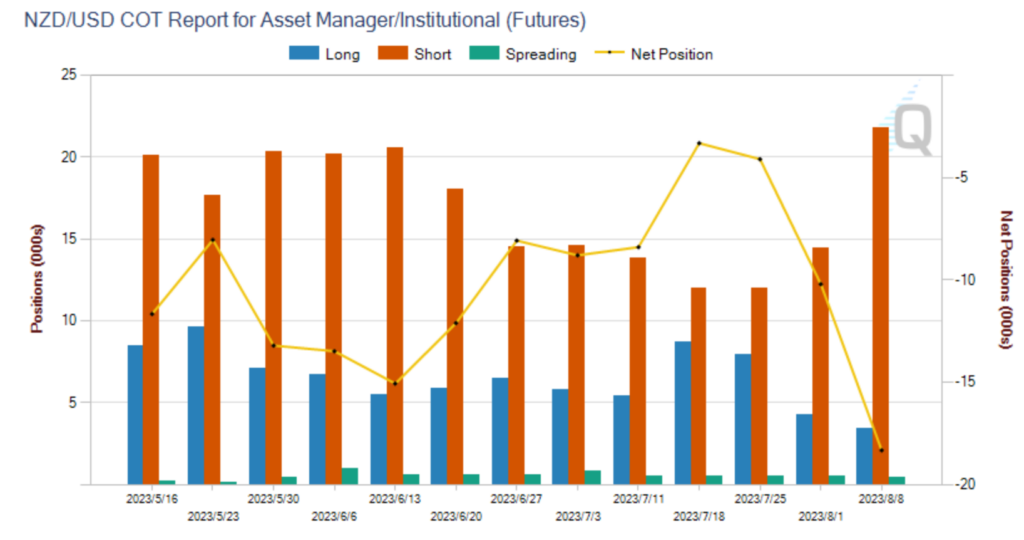
(Institutional short positions increased on NZD/USD)
The positions held by Institutional investors last week showed bearish sentiments on NZD/USD. If RBNZ unexpectedly raises interest rates, NZ’s exchange rate will rise rapidly in the short run.
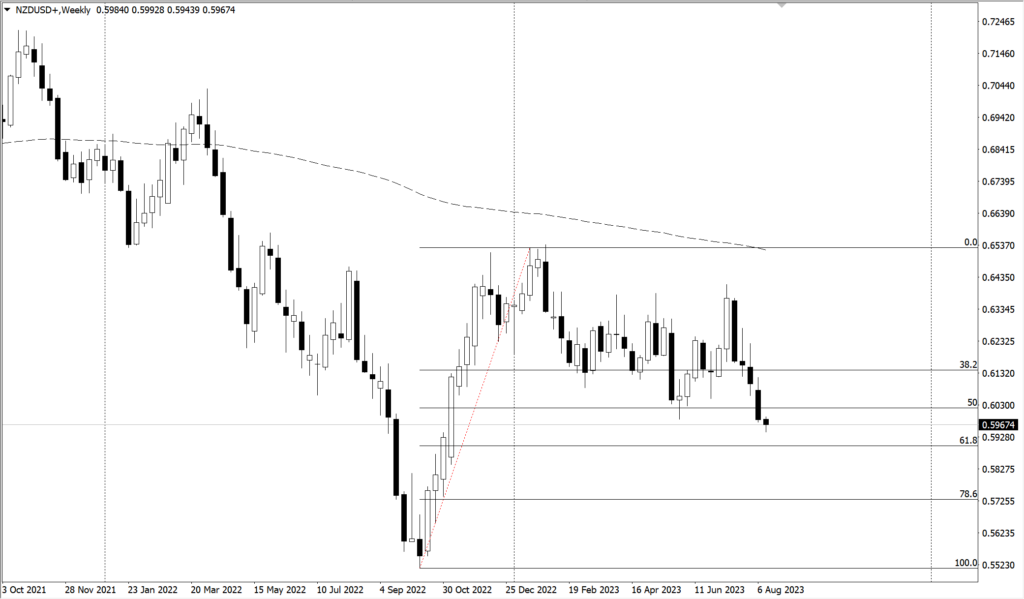
(NZD/USD weekly chart, Ultima Markets MT4)
Institutional Sentiments on NZD/USD
From a technical standpoint, the NZD /USD weekly cycle has fallen into short-term weakness, and the bottom is about to look at the Fibonacci 61.8% retracement position of the upward trend since September 2022.
The Crucial Role of Data and Monetary Policy
In conclusion, the outcome of the RBNZ’s decision hinges significantly on a blend of mixed economic data, inflation trends, and the broader economic outlook.
Investors are well-advised to keep a keen ear out for the central bank’s commentary on inflation and the overall state of the economy during the review.
Furthermore, observing the subsequent market response will provide invaluable insights into the trajectory of New Zealand’s monetary policy.
Disclaimer
Comments, news, research, analysis, price, and all information contained in the article only serve as general information for readers and do not suggest any advice. Ultima Markets has taken reasonable measures to provide up-to-date information, but cannot guarantee accuracy, and may modify without notice. Ultima Markets will not be responsible for any loss incurred due to the application of the information provided.
Last week, the reports released by the three major oil organizations gave investors a better understanding of the short-term crude oil market. After oil prices have been rising for some time, major adjustments are expected this week.
The Dynamics of Demand and Supply
In June 2023, global daily oil demand broke a record at 103 million barrels and is still expected to hit a peak in August.
According to the IEA, demand for crude from the 13 OPEC members averaged 29.8 million barrels per day in the October-December period, much higher than the 27.9 million barrels expected in July.
The OPEC monthly report shows that the growth rate of global crude oil demand in 2023 is expected to remain unchanged at 2.44 million barrels per day.
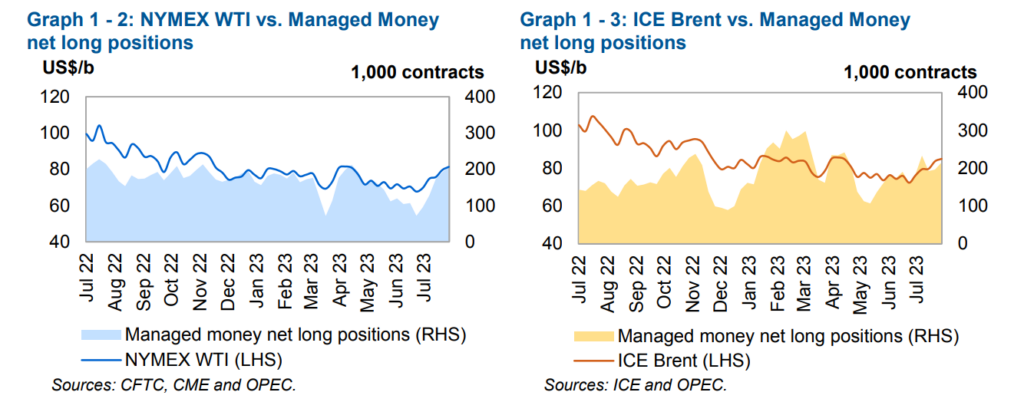
(Net long positions lifting oil prices, OPEC monthly report)
However, global oil supply fell by 910,000 barrels in July, mainly due to Saudi production cuts. Currently, crude oil inventories in developed countries are about 115 million barrels below the five-year average.
That suggests an increasingly tight market, partly due to falling supply. In 2H2023, the IEA forecasts a reduction in global inventories of about 1.7 million barrels per day, suggesting further tensions in the market could result in a bigger impact to prices.
Production Cuts and Their Impact
One of the standout factors contributing to the evolving oil market landscape is the strategic moves made by key oil-producing nations. Saudi Arabia’s unilateral production cuts and Russia’s reduced exports have jointly pushed the output of OPEC+ members to a nearly two-year low. This concerted effort to manage production has played a pivotal role in shaping the current scenario.
Unbalance between supply and demand leading price to swing
Oil prices maintained a steady uptrend in July. From an export standpoint, the export price of Russian crude has risen sharply, with an increase of US$ 8.84 per barrel, and the total price reached US$ 64.410.
Still, Russia’s oil revenues are down by more than a fifth from a year earlier, according to the IEA. However, technically speaking, crude prices will face an adjustment in the short run.
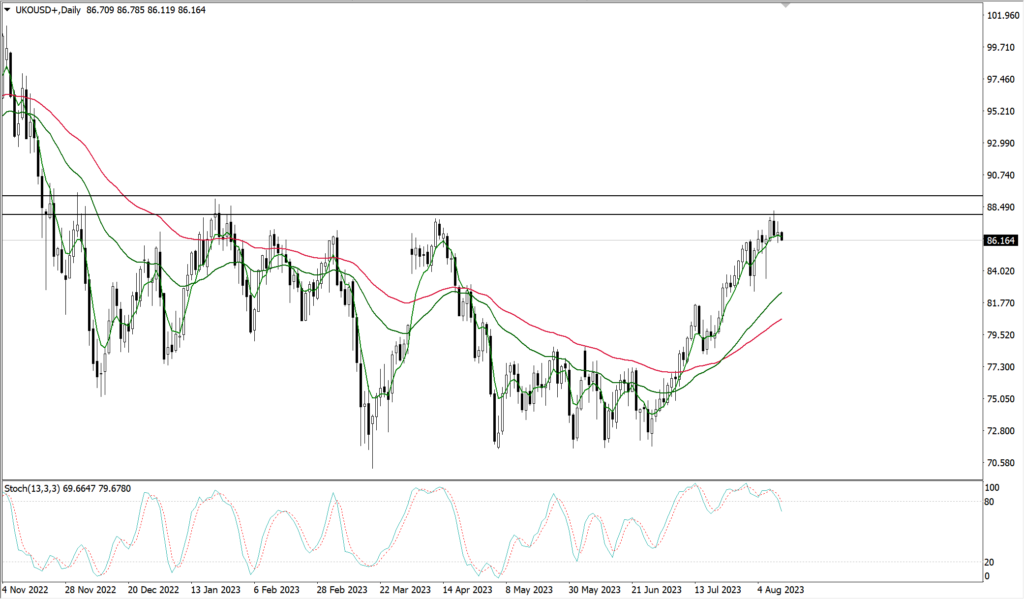
(Daily chart of Brent crude, Ultima Markets MT4)
Based on the daily chart shown above, crude price has reached the important resistance area of 87-88 US dollars. The Stochastic Oscillator is also showing divergence as the price keeps trying to move above this resistance zone.
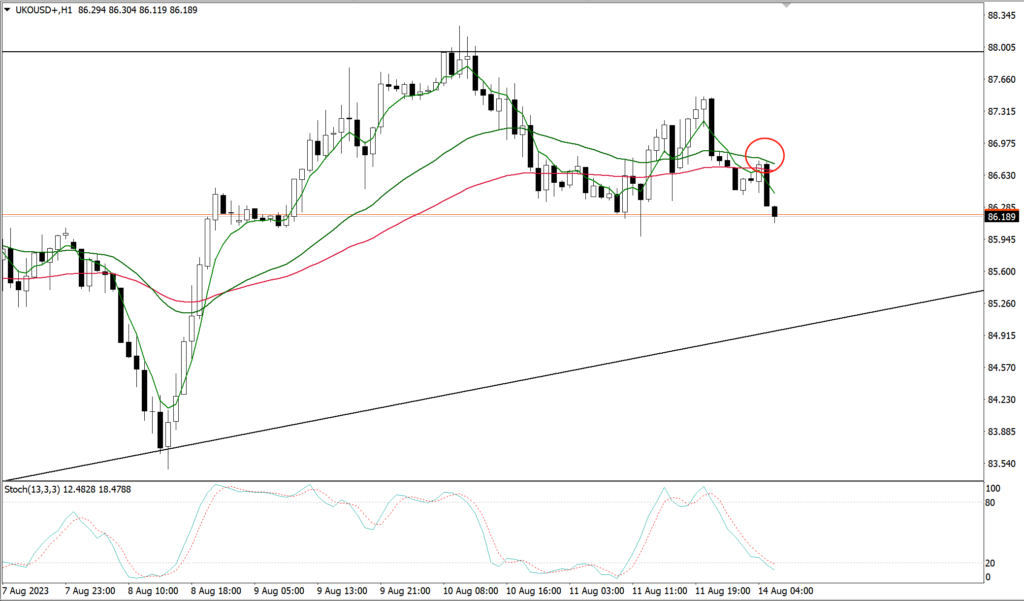
(1- hour chart of Brent crude, Ultima Markets MT4)
In the 1- hour period, the short-term moving average has completely declined, and the medium- and long-term moving average has completely fallen too, and the oil price has also made an effective correction. There is a certain downward pressure on oil prices within the day, and the bottom is looking at the upward trend line.
Overall, oil prices will see some downward pressure in the short run. However, with production cuts and stable demand growth, oil prices still have the momentum to rise this year.
Future Outlook
In conclusion, the oil market is poised to experience short-term downward pressure, influenced by the factors we’ve explored. However, the overarching dynamics, characterized by production cuts and a stable growth in demand, suggest that oil prices still possess the momentum for a potential rise in the year ahead.
It’s important to note that the oil market is susceptible to a multitude of variables and is subject to frequent changes. As an investor or observer, it’s crucial to stay informed about the latest developments and insights to make informed decisions in this ever-evolving market.
Disclaimer
Comments, news, research, analysis, price, and all information contained in the article only serve as general information for readers and do not suggest any advice. Ultima Markets has taken reasonable measures to provide up-to-date information, but cannot guarantee accuracy, and may modify without notice. Ultima Markets will not be responsible for any loss incurred due to the application of the information provided.