Fewer S&P 500 Companies Citing “Inflation” in 2Q23 Conference Calls 

Deciphering the Decline in S&P 500 Companies Citing “Inflation” in 2Q23 Conference Calls

Through Document Search, FactSet searched for the term “inflation” in the conference call transcripts of all the S&P 500 companies that conducted earnings conference calls from June 15 through September 7. 


The Numerical Dip in S&P 500

Of these companies, 296 cited the term “inflation” during their earnings calls for the second quarter. This is the lowest number of S&P 500 companies citing “inflation” on earnings calls going back to Q2 2021 (221). It also marks the fourth consecutive quarter in which the number of S&P 500 companies citing the term “inflation” has declined quarter-over-quarter.

However, it should be noted that the number of S&P 500 companies citing “inflation” on earnings calls for Q2 2023 is still well above the 5-year average of 217 and the 10-year average of 168. 


Sectoral Insights in S&P 500

At the sector level, the Financials (49) and Industrials (46) sectors have the highest number of companies that cited “inflation” on earnings calls for Q2. However, the Consumer Staples (86%), Consumer Discretionary (76%), and Materials (76%) sectors have the highest percentages of companies that cited “inflation” on their Q2 earnings calls during this period. 


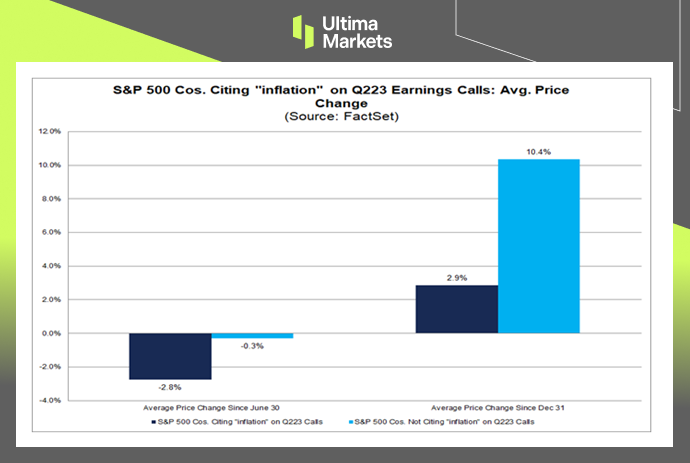
Impact on Stock Performance in S&P 500 Companies

It is interesting to note that S&P 500 companies that cited “inflation” on Q2 earnings calls have seen a weaker average stock price performance in recent months compared to S&P 500 companies that did not cite “inflation” on Q2 earnings calls.

For S&P 500 companies that cited “inflation” on Q2 earnings calls, the average change in price since June 30 is -2.8% and the average change in price since December 31 is 2.9%. For S&P 500 companies that did not cite “inflation” on Q2 earnings calls, the average change in price since June 30 is -0.3% and the average change in price since December 31 is 10.4%. 

S&P 500 Survey by FactSet

(Survey by FactSet) 


Conclusion

In conclusion, while the decline in the number of S&P 500 companies referencing “inflation” in their earnings calls is noteworthy, it’s crucial to view these statistics within the broader context.

The relative high numbers compared to historical averages indicate that the topic remains relevant. Additionally, the varying stock performance for companies mentioning “inflation” presents a compelling puzzle for investors and analysts alike.

As the financial landscape continues to evolve, it is imperative to closely monitor these trends to make informed investment decisions.


Disclaimer  

Comments, news, research, analysis, price, and all information contained in the article only serve as general information for readers and do not suggest any advice. Ultima Markets has taken reasonable measures to provide up-to-date information, but cannot guarantee accuracy, and may modify without notice. Ultima Markets will not be responsible for any loss incurred due to the application of the information provided. 

The Surreal Saga of UK Government’s Skyrocketing Debt

The UK’s Mounting Debt Crisis

UK government debt has soared more than 40% since the Covid-19 outbreak in March 2020, reaching nearly 2.6 trillion pounds ($3.3 trillion), the highest level since the early 2020s and about the same as the country’s annual gross domestic product.


Inflation-Linked Debt: A Troubling Reality

Although some developed countries, for example, the US has debts as a high percentage in its GDP, the UK is unique in this case because 1/4 of its government debt is “index-linked to inflation”.

As prices surged in the UK over the past 18 months, so have government repayments of interest on inflation-linked bonds.


The Burden of High Inflation

In the latest fiscal year, high inflation resulted in the highest debt ratio in 40 years, weighing on the country’s finances as it grapples with weak economic growth and an election looming pressure.

The credit ratings company Fitch said, “Britain has a higher debt-repay as a share of government revenue than any other advanced economy.”


The Looming Specter of Credit Downgrade

Britain’s growing debt burden puts it in a precarious position. A downgrade of the country’s credit rating could further raise borrowing costs, although the impact is likely to be limited.

Earlier this month, Fitch canceled the U.S.’s AAA rating, one of the reasons was the increase in the U.S. debt ratio.

Fitch ‘s current rating outlook on the UK is negative, which means the risk of the country’s rating being downgraded to A from the current AA- rating increases.


Future Outlook: Waiting for Rating Agencies’ Verdict

The UK’s financial landscape is poised for a significant transformation. Moody’s and S&P are set to release their assessments of the nation’s credit rating on October 20th, with Fitch following suit on December 1st.

These impending evaluations will play a pivotal role in shaping the UK’s financial future.

(UK ratings, Fitch)


Conclusion

In conclusion, the UK’s escalating government debt crisis demands immediate attention. As this hierarchical presentation illustrates, the mounting debt, coupled with inflation-linked complications, has profound implications.

The nation’s credit rating, currently at risk, hinges on the impending assessments by rating agencies. Staying informed and prepared for potential developments in the UK’s financial stability is of utmost importance.


Disclaimer

Comments, news, research, analysis, price, and all information contained in the article only serve as general information for readers and do not suggest any advice. Ultima Markets has taken reasonable measures to provide up-to-date information, but cannot guarantee accuracy, and may modify without notice. Ultima Markets will not be responsible for any loss incurred due to the application of the information provided.

The UK’s Interest Rate Odyssey: Understanding the Essentials

UK Rate Hikes Reached A Plateau 

Bank of England Governor Andrew Bailey said at a Treasury Select Committee hearing on the 7th that the interest rate hike policy is close to the peak, and BoE’s Monetary Policy Committee will make another decision on September 21.  


The Announcement

Britain’s annual inflation rate of 6.8 percent is higher than Prime Minister Rishi Sunak’s planned target of 5 percent by the end of 2023 and is the highest among G7 nations.

The governor explained that due to the increase in crude prices, the inflation data in August may be slightly higher than expected. At the same time, he believes that inflation will be obvious by the end of this year, especially in autumn.

In addition, he pointed out that the Monetary Policy Committee may finally vote in support of raising interest rates in September. 

(Bank rate record, Bank of England) 


Economic Insights

The Bank of England released a monthly survey on the 8th, showing output prices are expected to increase by 4.9% in the next 12 months. The figure, based on a three-month rolling average, was down 0.5 percentage from July and well below last year’s peak of 6.6% in September.

The outlook for wage growth has also dropped to an average of 5.1%, continuing a downward trend from a high of 6% in late 2022. The survey of recruiters points out a cooling labor market. The findings could slow the central bank’s pace of raising interest rates. 


Conclusion

In conclusion, it’s evident that the United Kingdom is currently facing a challenging economic situation with a persistently high inflation rate and signs of a cooling labor market. The comments made by Bank of England Governor Andrew Bailey and the data from the recent survey have sparked discussions about the future of interest rates and economic stability.

As we move forward, it’s crucial for individuals and businesses to monitor these developments closely, as they have the potential to impact various aspects of the economy. Whether you are a trader, investor, or simply someone interested in economic matters, staying informed is the key to making well-informed decisions in these uncertain times.

Remember that financial markets can be volatile, and it’s advisable to seek professional advice and conduct thorough research before making any significant financial decisions. As we await the upcoming decision by the BoE’s Monetary Policy Committee on September 21, the economic landscape in the UK remains a topic of great interest and importance.


Disclaimer  

Comments, news, research, analysis, price, and all information contained in the article only serve as general information for readers and do not suggest any advice. Ultima Markets has taken reasonable measures to provide up-to-date information, but cannot guarantee accuracy, and may modify without notice. Ultima Markets will not be responsible for any loss incurred due to the application of the information provided. 

August ISM Surprise: A Perspective On Economic Fireworks

August Service ISM Surged, Heating up Concerns Over Inflation 

The Institute for Supply Management released the ISM services index for August, which showed a recovery in business activity. The index unexpectedly rose to 54.5 from market expectations of 52.5, up from 52.7 in July and reaching a six-month peak.

From the analysis of the service industry portfolio, as many as 13 of the 18 industries surveyed by the ISM non-manufacturing industry have increased.

Industries such as catering and accommodation, real estate leasing, construction, retail, transportation and warehousing have shown steady expansion of new order demand and willingness to recruit.

The service industry data was better than expected, driving up treasury yields, meanwhile, putting pressure on stock markets. The three major U.S. stock indexes all ended in decline. 

The ISM Non-Manufacturing Index profile 

The ISM Non-Manufacturing Index is a comprehensive indicator that tracks non-manufacturing activities such as employment trends, prices, new orders and other sub-items.

The index takes 50 as the critical point. If the index is at 50, it means that the economy of this month remains unchanged from the previous month; if the index is above 50 for several consecutive months, it indicates that non-manufacturing activities are expanding and prices are rising, implying that the overall economy is in expanding state.

On the contrary, when the index is below the 50 level, it means that the overall economy is in a state of contraction. 

(Service PMI, Institute for Supply Management ISM) 


Conclusion

The August ISM services index report has introduced a level of unpredictability and excitement to the financial landscape. It’s not just a data report; it’s a narrative, a story with twists and turns that continue to unfold.

To stay updated on this ever-evolving economic drama and gain access to expert analysis, make sure to follow our platform closely. We offer the key to unraveling the complex world of finance and economics, providing you with a structured approach to understanding the latest developments.


Disclaimer  

Comments, news, research, analysis, price, and all information contained in the article only serve as general information for readers and do not suggest any advice. Ultima Markets has taken reasonable measures to provide up-to-date information, but cannot guarantee accuracy, and may modify without notice. Ultima Markets will not be responsible for any loss incurred due to the application of the information provided. 

Shifting Tides in the Euro Zone: ECB Lagarde’s Influence

Watch out for ECB Lagarde’s words

At last, the euro has shrugged off bad economic news and inflation has come under control. It might be the time for ECB to reconsider its tightening monetary policy . Investors will focus on whether the European Central Bank will pause interest rate hikes in September as expected.

(Inflation rates in the euro zone in the past year)


ECB’s Dilemma: To Hike or Not to Hike

The August PMI report due on Wed. is going to be in the spotlight. Forecasts show the manufacturing sector slumps further, and start to take a toll on services sector, endangering the euro zone economy.

With sluggish numbers, the ECB could take a break in September rate hike, however, the euro might receive a hit. Most economists believe the ECB will pause rate hikes in September but see room for an increase before the end of 2023 amid rising inflation.


Lagarde’s Utterances: A Market Barometer

Separately, at the Jackson Hole Global Central Bank Economic Symposium on Saturday, European Central Bank President Lagarde’s speech is going to be very important. Investors will look for clues from the review.


U.S. Economic Resilience

Based on data released in the past week, the US economy continued to maintain a strong momentum. Retail sales and manufacturing figures unexpectedly rose as residential numbers climbed. The strength of the U.S. dollar has caused the euro to remain in a downward trend.

(EUR/USD daily cycle, Ultima Markets MT4)

July 4th represents a turning point at present. If it is broken, the upward momentum will subside, leaving little hope for EUR/USD to stage a rebound.


Market Volatility: The Lagarde Effect

It is worth noting that the overall volatility of the euro against the US dollar has slowed down significantly. Both the overall volatility on the chart and the average level of the 200 -period ATR indicators are declining. As a result,  Lagarde’s speech is going to shift the market volatility.

Conclusion

In conclusion, as we navigate the complex web of economic variables, ECB President Lagarde’s words loom large on the horizon.

The ECB’s delicate balancing act and the resilient U.S. economy have set the stage for a captivating narrative in the world of finance.

For investors and market participants, astutely decoding the signals emanating from these developments will be essential in making informed decisions.


Disclaimer

Comments, news, research, analysis, price, and all information contained in the article only serve as general information for readers and do not suggest any advice. Ultima Markets has taken reasonable measures to provide up-to-date information, but cannot guarantee accuracy, and may modify without notice. Ultima Markets will not be responsible for any loss incurred due to the application of the information provided.

Understanding Japan’s Inflation and Its Impact on the Yen

With easing policy, Yen sets to depreciate

Japan announced the latest July core CPI annual rate excluding fresh foods rose 3.1% year-over-year, slightly down from 3.3% in the previous month.

The figure matched with the Bank of Japan’s expectation. The slowdown is linked to lower energy prices, especially data from the Tokyo region showing a slight deceleration in inflation.

(Japan’s inflation level in the past year)


A Cautious Approach by the Bank of Japan

The BOJ’s holding back on raising rates makes a sharp contrast to its peers. The Bank of Japan has taken steps to curb potential economic risks, including allowing long-term government bond yields to rise to 1%. However, the monetary policies have not prevented the yen from depreciation.


The USD/JPY Exchange Rate

The exchange rate of USD/JPY began to fall in the past two days but remained above the high of 145. Over time, Japan’s low rate could lead to capital outflows, putting downward pressure on the yen.

(USD/JPY daily cycle, Ultima Markets MT4)


External Factors at Play

The future of the yen is not solely determined by Japan’s economic policies. External factors, such as global crises or recessions, can play a crucial role in shaping the currency’s fate. A crisis or recession might deter further rate cuts, yet the strength of the U.S. economy reduces this possibility.


A Turning Point at 150

Although the Japanese government could intervene the yen’s depreciation, its long-term course might remain unchanged. 150 marks a turning point. If USD/JPY rises above it, the Bank of Japan is expected to step into the market.


The Ongoing Tug-of-War

In summary, Japan’s inflation levels and the state of the global economy continue to be key determinants in the yen’s value. Under the current circumstances, the Bank of Japan’s easing policy is likely to support the trend of yen depreciation.

However, it’s essential to remember that external factors can still bring about short-term changes in this delicate balance.


Disclaimer

Comments, news, research, analysis, price, and all information contained in the article only serve as general information for readers and do not suggest any advice. Ultima Markets has taken reasonable measures to provide up-to-date information, but cannot guarantee accuracy, and may modify without notice. Ultima Markets will not be responsible for any loss incurred due to the application of the information provided.

Unraveling the RBNZ Interest Rate Decision and its Implications

RBNZ might hold rates unchanged while institutions short on NZD

The Federal Reserve Bank of New Zealand will announce the latest interest rate decision on Wednesday, and the market expects to keep the OCR official cash rate unchanged at 5.50%.

At the moment, global economics are cooling, while the figures released by RBNZ are not strong enough.

Consequently, RBNZ gains space to keep interest rates unchanged and time to observe the inflation situation further.


The Intricacies of the New Zealand Economy

NZ economic data displays a mixed picture, with inflation data tapering off despite resilient demand, leaving investors conflicting signals. NZ economic conditions have not weakened as badly as previously expected.

(NZ inflation rates in one year)

Although inflation has started to fall, it has remained high. The strong labor market has prompted RBNZ to postpone an expected rate cut originally scheduled for the fourth quarter of 2023 until the second quarter of 2024.

The wage growth has declined, however, stayed at an elevated level, hampering RBNZ to reach its inflation goal. NZ’s GDP growth rate is expected to pick up slightly in 2023, showing some resilience in its economy.

(NZ job vacancies decreased since July 2022)


The Uncertainty Surrounding OCR

A ‘watch, worry, and wait’ stance seems the most likely outcome of the OCR review. However, some institutions believe it is possible to see rates go up to 5.75% in the future. The divergence reflects market uncertainty toward inflation and the economic outlook.

(Institutional short positions increased on NZD/USD)

The positions held by Institutional investors last week showed bearish sentiments on NZD/USD. If RBNZ unexpectedly raises interest rates, NZ’s exchange rate will rise rapidly in the short run.

(NZD/USD weekly chart, Ultima Markets MT4)


Institutional Sentiments on NZD/USD

From a technical standpoint, the NZD /USD weekly cycle has fallen into short-term weakness, and the bottom is about to look at the Fibonacci 61.8% retracement position of the upward trend since September 2022.


The Crucial Role of Data and Monetary Policy

In conclusion, the outcome of the RBNZ’s decision hinges significantly on a blend of mixed economic data, inflation trends, and the broader economic outlook.

Investors are well-advised to keep a keen ear out for the central bank’s commentary on inflation and the overall state of the economy during the review.

Furthermore, observing the subsequent market response will provide invaluable insights into the trajectory of New Zealand’s monetary policy.


Disclaimer

Comments, news, research, analysis, price, and all information contained in the article only serve as general information for readers and do not suggest any advice. Ultima Markets has taken reasonable measures to provide up-to-date information, but cannot guarantee accuracy, and may modify without notice. Ultima Markets will not be responsible for any loss incurred due to the application of the information provided.

The Thrilling Rollercoaster: Oil Prices in Turmoil

Oil, A Fiery Tale of Supply and Demand

Last week, the reports released by the three major oil organizations gave investors a better understanding of the short-term crude oil market. After oil prices have been rising for some time, major adjustments are expected this week.

The Dynamics of Demand and Supply

In June 2023, global daily oil demand broke a record at 103 million barrels and is still expected to hit a peak in August.

According to the IEA, demand for crude from the 13 OPEC members averaged 29.8 million barrels per day in the October-December period, much higher than the 27.9 million barrels expected in July.

The OPEC monthly report shows that the growth rate of global crude oil demand in 2023 is expected to remain unchanged at 2.44 million barrels per day.

(Net long positions lifting oil prices, OPEC monthly report)

However, global oil supply fell by 910,000 barrels in July, mainly due to Saudi production cuts. Currently, crude oil inventories in developed countries are about 115 million barrels below the five-year average.

That suggests an increasingly tight market, partly due to falling supply. In 2H2023, the IEA forecasts a reduction in global inventories of about 1.7 million barrels per day, suggesting further tensions in the market could result in a bigger impact to prices.


Production Cuts and Their Impact

One of the standout factors contributing to the evolving oil market landscape is the strategic moves made by key oil-producing nations. Saudi Arabia’s unilateral production cuts and Russia’s reduced exports have jointly pushed the output of OPEC+ members to a nearly two-year low. This concerted effort to manage production has played a pivotal role in shaping the current scenario.


Unbalance between supply and demand leading price to swing

Oil prices maintained a steady uptrend in July. From an export standpoint, the export price of Russian crude has risen sharply, with an increase of US$ 8.84 per barrel, and the total price reached US$ 64.410.

Still, Russia’s oil revenues are down by more than a fifth from a year earlier, according to the IEA. However, technically speaking, crude prices will face an adjustment in the short run.

(Daily chart of Brent crude, Ultima Markets MT4)

Based on the daily chart shown above, crude price has reached the important resistance area of 87-88 US dollars. The Stochastic Oscillator is also showing divergence as the price keeps trying to move above this resistance zone.

(1- hour chart of Brent crude, Ultima Markets MT4)

In the 1- hour period, the short-term moving average has completely declined, and the medium- and long-term moving average has completely fallen too, and the oil price has also made an effective correction. There is a certain downward pressure on oil prices within the day, and the bottom is looking at the upward trend line.

Overall, oil prices will see some downward pressure in the short run. However, with production cuts and stable demand growth, oil prices still have the momentum to rise this year.


Future Outlook

In conclusion, the oil market is poised to experience short-term downward pressure, influenced by the factors we’ve explored. However, the overarching dynamics, characterized by production cuts and a stable growth in demand, suggest that oil prices still possess the momentum for a potential rise in the year ahead.

It’s important to note that the oil market is susceptible to a multitude of variables and is subject to frequent changes. As an investor or observer, it’s crucial to stay informed about the latest developments and insights to make informed decisions in this ever-evolving market.


Disclaimer

Comments, news, research, analysis, price, and all information contained in the article only serve as general information for readers and do not suggest any advice. Ultima Markets has taken reasonable measures to provide up-to-date information, but cannot guarantee accuracy, and may modify without notice. Ultima Markets will not be responsible for any loss incurred due to the application of the information provided.

Analyzing U.S. Nonfarm Payrolls and Its Impact on the Dollar

The non-farm payrolls have passed, the inflation data has come, and the dollar is still in decline

Last Friday, August 4th, the U.S. nonfarm payrolls data fell short of expectations for the second consecutive month. According to the data released by the U.S. Department of Labor, the seasonally adjusted non-agricultural employment in the United States increased by 187,000 in July, the lowest number of new jobs since December 2020, compared with market expectations of 200,000.


Nonfarm Payrolls: A Disappointing Trend

Previously, new job figures for May and June were revised down as well. The May’s number was revised down from 339,000 to 306,000 and the June’s down to 185,000.

It is worth noting that ADP, the identical twin of non-agricultural employment data, also showed a downward trend in August, and this time it did not show the opposite trend to the nonfarm payrolls data.

The divergence in the first two months made the reference value of ADP to decrease.

(Blue column vs black line; non-farm payrolls vs ADP)


Unemployment Rate and Hourly Wages

On the other hand, the unemployment rate eased to 3.5% from 3.6 % in June. In addition, the hourly wage continued to record steady growth in July, increasing by 4.4% year-on-year, beating expectations of 4.2%. The increase in hourly wages may not be what the FED wants to see because of its 2% inflation target.


FED’s Role in the Labor Market

Elon, analyst at Ultima Markets Investment Research Group, said “In general, the FED’s continued tightening policy has begun to take effect in the labor market, and the decline in the number of new jobs for two consecutive months represents the beginning of cooling job market. As a result, the consensus for rate hike in September has not changed significantly.

(The chance that the Fed will not raise interest rates stays at nearly 90%, sourced from the Fed Interest Rate Observation Tool)


Impact on Gold and Non-U.S. Currencies

Gold and non-US currencies altogether is happy with the expectation of the Fed’s move to leave interest rates unchanged. It is important to watch out for inflation data this week. Last month, the inflation rate returned to 3%. If the inflation continues cooling, the dollar will go downwards again.

(CPI rates in one year)


Technical Analysis of the Euro

Technically, the euro finds its support on the back of 1.09, rising above the 65-day moving average and the 5-day moving average again. The Stochastic Oscillator is also showing a golden cross gesture, suggesting an underlying bullish trend. If the euro breaks through the peak last week, it will expectedly resume an uptrend.

(Daily chart of EUR/USD, Ultima Markets MT4)


Disclaimer

Comments, news, research, analysis, price, and all information contained in the article only serve as general information for readers and do not suggest any advice. Ultima Markets has taken reasonable measures to provide up-to-date information, but cannot guarantee accuracy, and may modify without notice. Ultima Markets will not be responsible for any loss incurred due to the application of the information provided.

BoE raises interest rates, and the pound rebounds

The Impact of BoE’s Interest Rate Hike on the Pound and the Economy

To combat inflation, the BoE makes its 14th move to raise interest rates by 25 bps, marking a new high of 5.25% since 2008.

(UK Interest rates in the past 25 years)

(BoE briefing in Aug.)


BoE’s Battle Against Inflation

BoE’s consecutive 25bps rate hikes made the market no longer optimistic on the future, lowering the estimate from 5.74% to around 5.68%. Meanwhile the pound came under pressure. BoE has repeatedly emphasized its view that the British economy would not head for a recession and revised the GDP growth rate for 2023 from 0.25% to 0.5% in May.


Heavy Borrowing Costs

High rates mean heavy borrowing costs, putting pressure on mortgage borrowers. Tenants also suffer as homeowners pass on their additional burden. The average two-year mortgage rate in the UK is now close to 7%. The future economic status will need to be verified by further data.

(4-hour graph of GBP/USD)


GBP/USD’s Reaction

Technically, GBP/USD gains upward space after interest rate hikes. In the 4-hour period, the price action shows a clear Wolfe wave.

Point 3 is below point 1, point 4 retreats to the price range between point 2 and point 3, and point 5 rebounds upward after falling to the line connecting point 1 and point 3 yesterday.

In the short term, GBP/USD has a certain chance of rebounding. The first target is at point 4, and the second target is the line connecting point 1 and point 4.


Conclusion

In conclusion, the Bank of England’s interest rate hike has introduced various challenges and opportunities in the financial landscape.

With the pound’s fluctuations, the burden on borrowers, and the technical patterns in GBP/USD, the economic impact of this decision will continue to unfold.

It’s imperative for individuals and businesses to stay informed and make well-informed financial decisions in this evolving landscape.


Disclaimer

Comments, news, research, analysis, price and all information contained in the article only serve as general information for readers, and do not suggest any advice. Ultima Markets has taken reasonable measures to provide up-to-date information, but cannot guarantee accuracy, and may modify without notice. Ultima Markets will not be responsible for any loss incurred due to the application of the information provided.