Comprehensive AUD/USD Analysis for September 21, 2023
In this comprehensive analysis, Ultima Markets brings you an insightful breakdown of the AUD/USD for 21st September 2023.
Key Takeaways
Federal Reserve’s Monetary Policy: Key to understanding this dynamic currency pair is the recent decision by the Federal Reserve.
In September, they opted to halt interest rate hikes. Notably, the dot plot still indicates the potential for rate increases later in the year.
Looking ahead, the monetary policy for the following year leans towards a more hawkish stance, with the likelihood of a shift from 5 interest rate cuts to just 2.
These developments have bolstered the US dollar, placing non-US currencies at a short-term disadvantage.
AUD/USD Technical Analysis
Understanding the technical aspects of AUD/USD is paramount for making informed trading decisions. Here, we provide an exhaustive analysis of the charts, offering a comprehensive view of the current scenario.
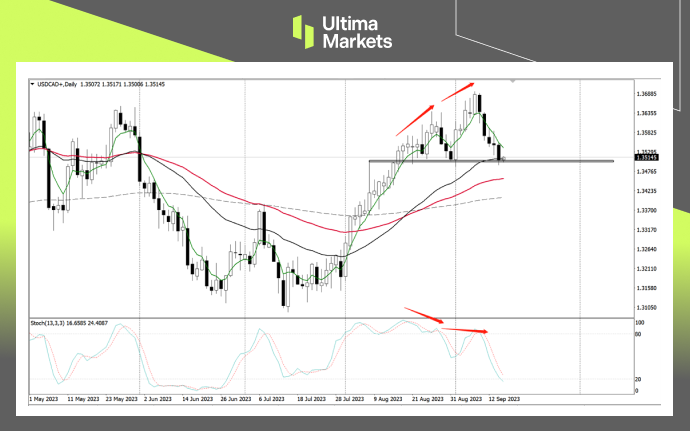
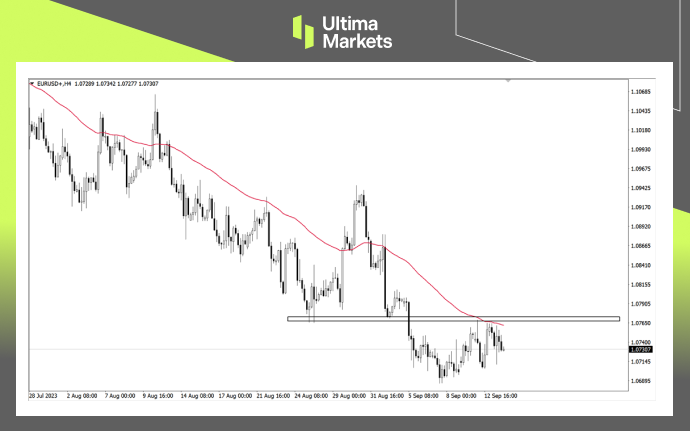
AUD/USD Daily Chart Analysis
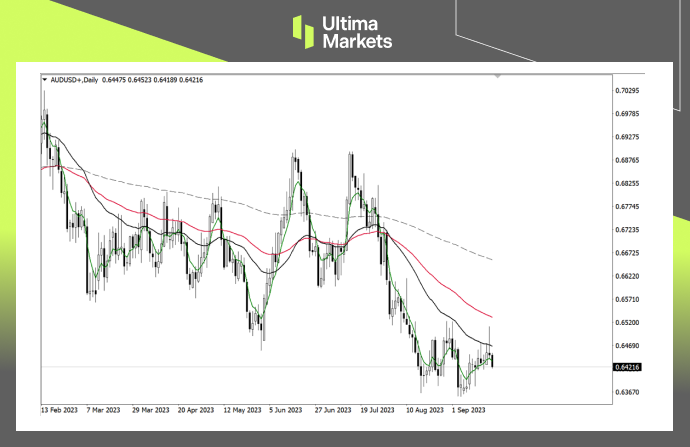
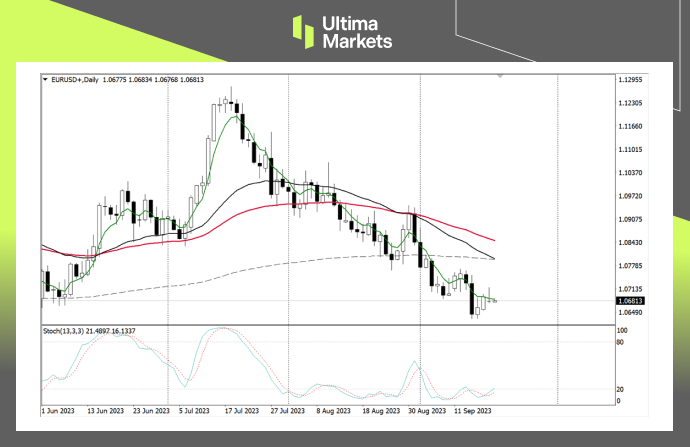
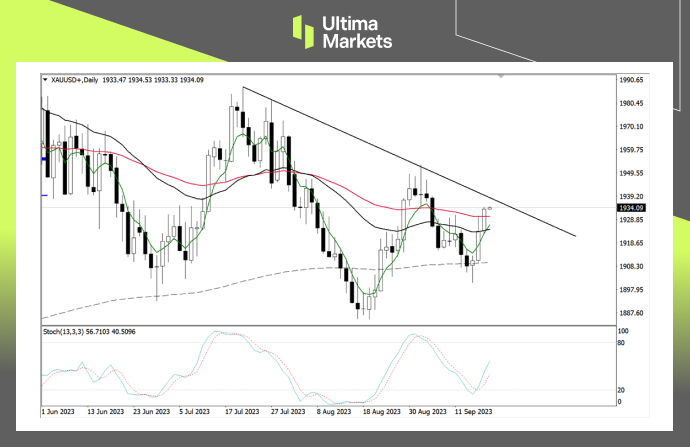
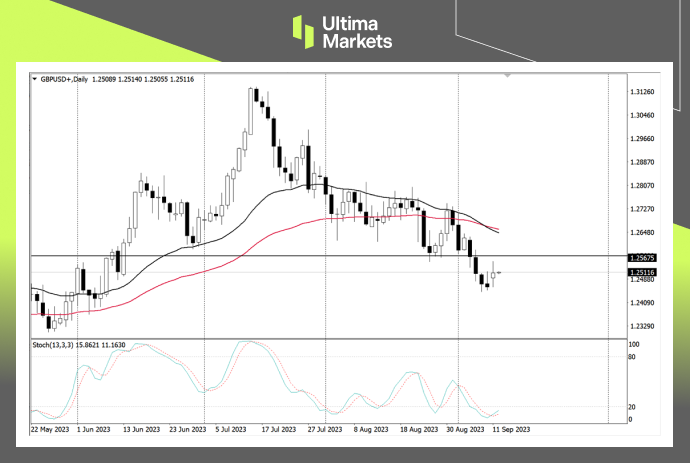
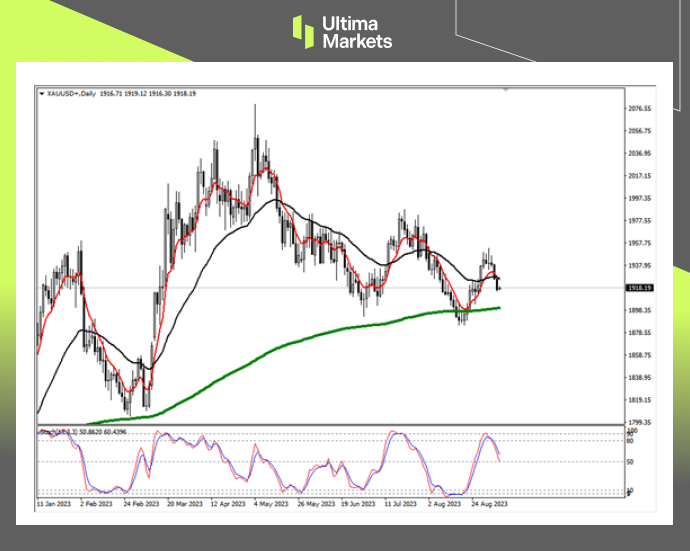
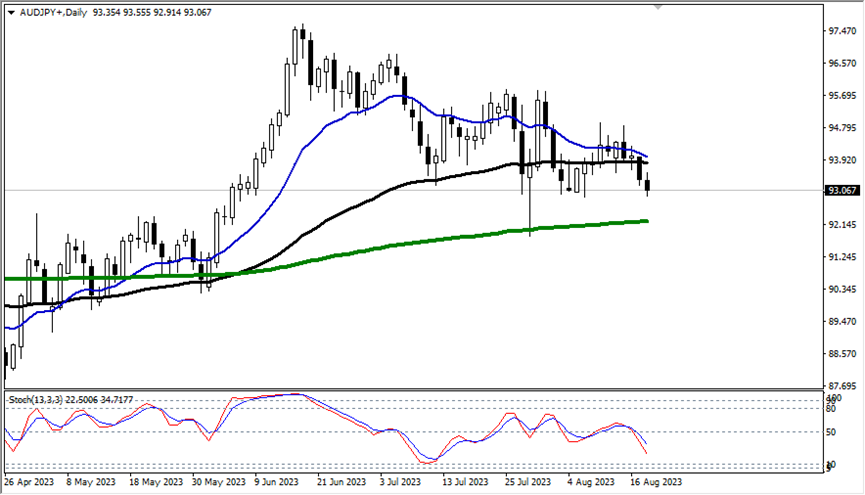
( Daily chart of AUD/USD, source: Ultima Markets MT4)
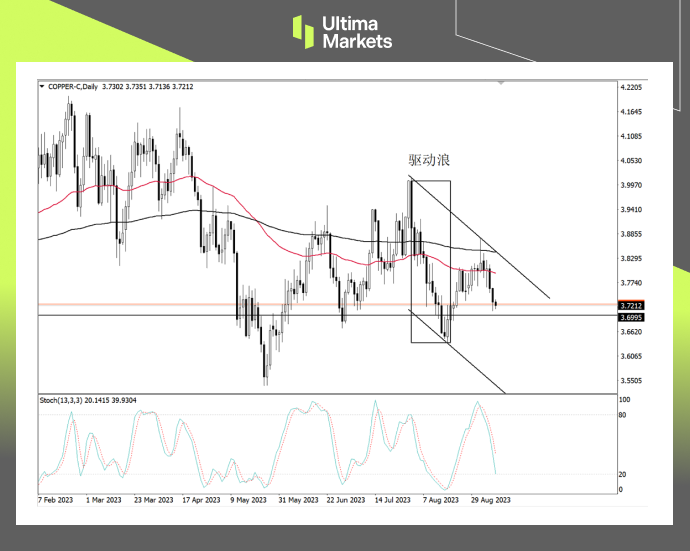
The daily chart reveals a noteworthy pin bar formation in the Australian dollar against the US dollar, following contact with the 33-day moving average.
This development carries significance, particularly given the robust position of the US dollar, which may exert further downward pressure on the exchange rate.
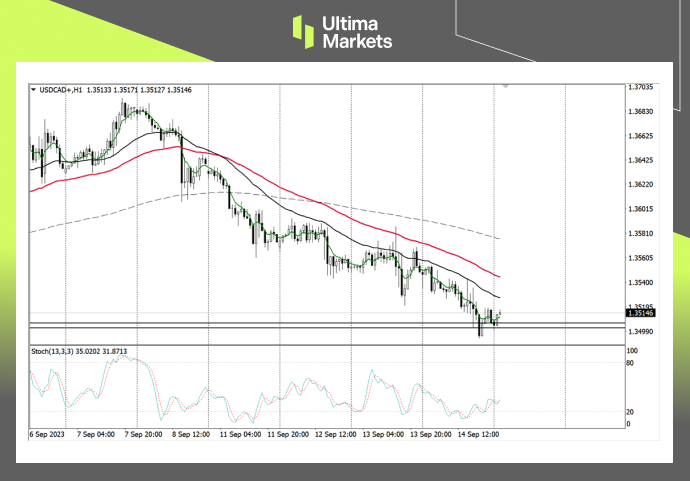
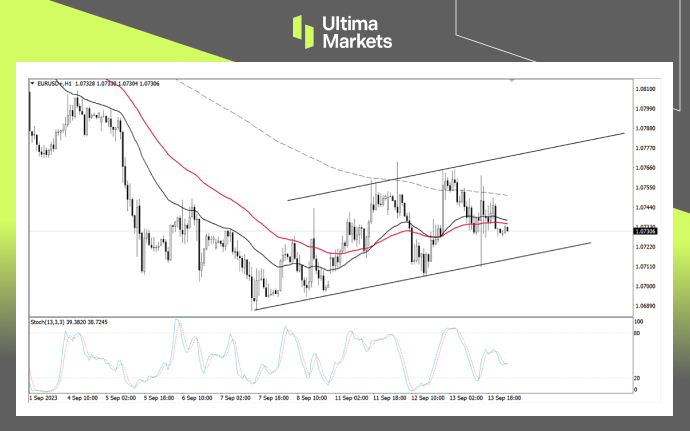
Analyzing the AUD/USD 4-Hour Chart
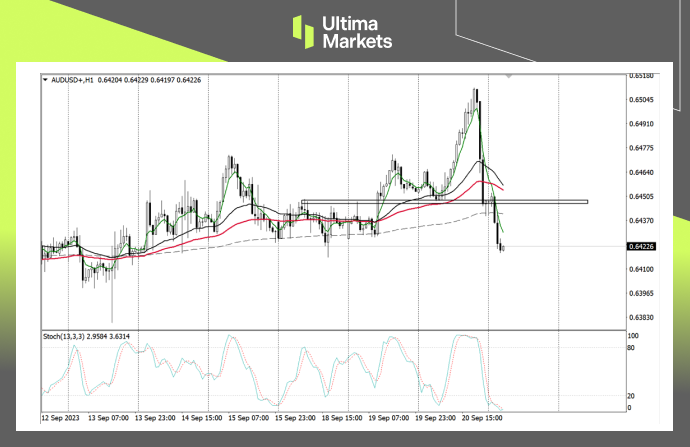
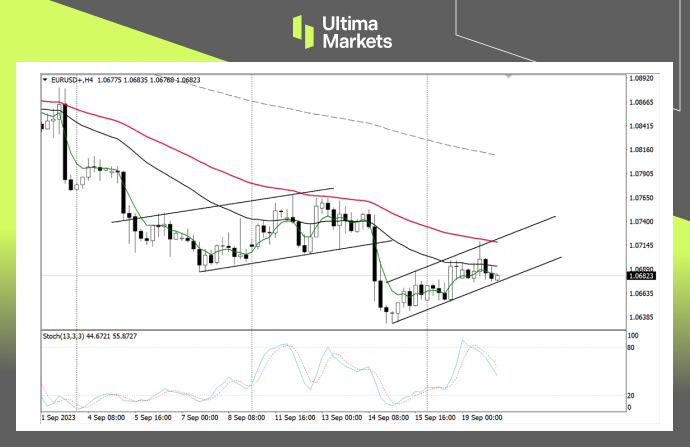
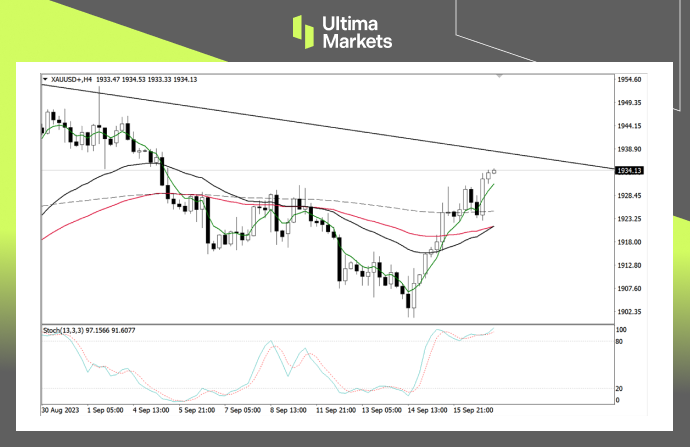
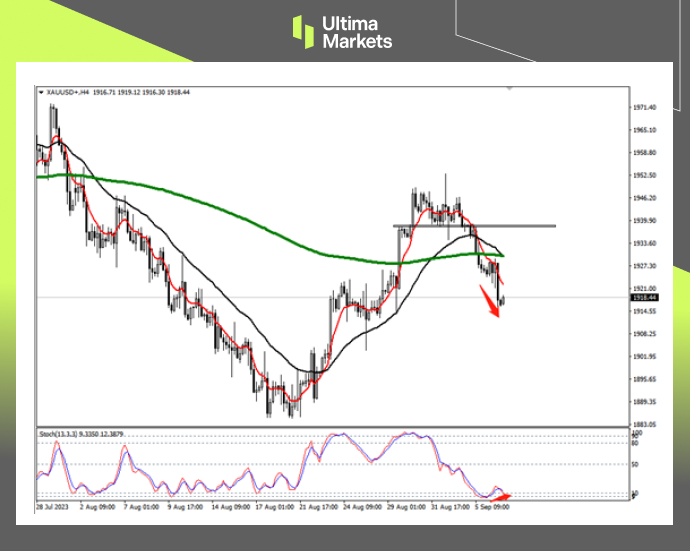
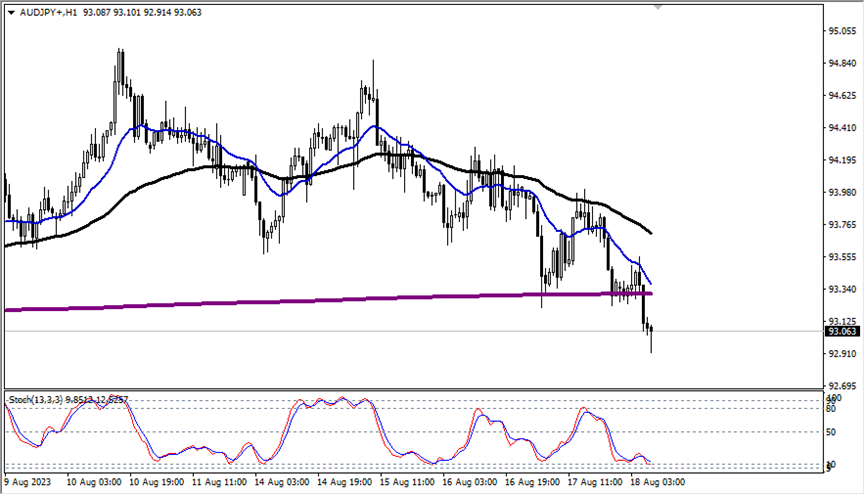
(4-hour chart of AUD/USD, source: Ultima Markets MT4)
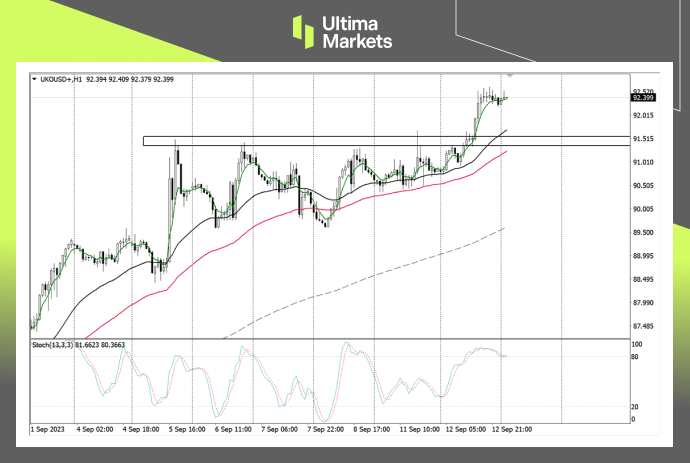
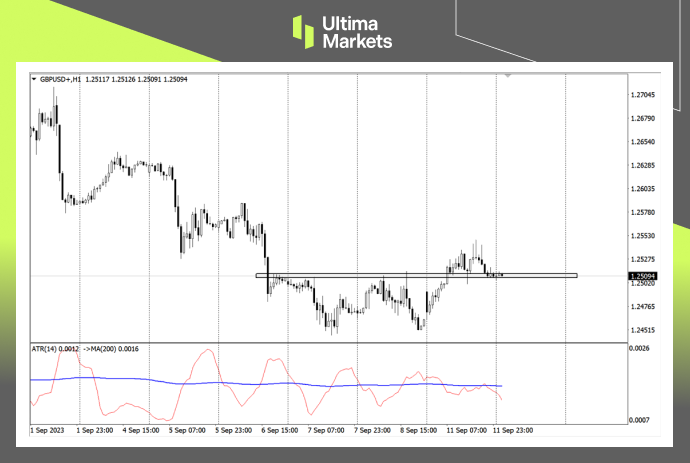
Structurally, the market has formed a platform corrective wave, indicating a probability of the ongoing downward trend.
This insight is invaluable for anticipating market dynamics and making well-informed trading decisions.
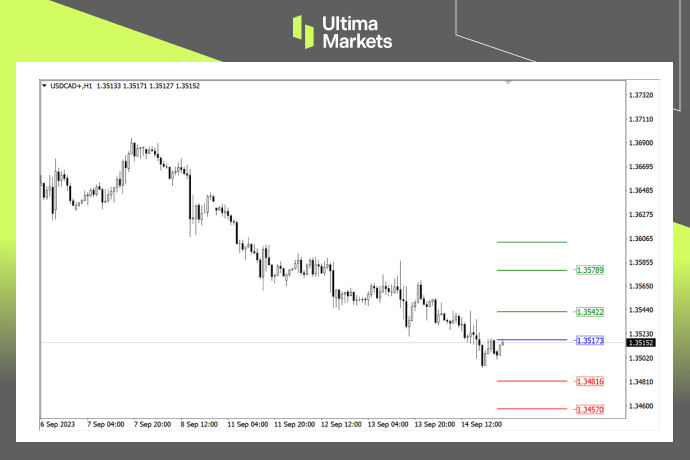
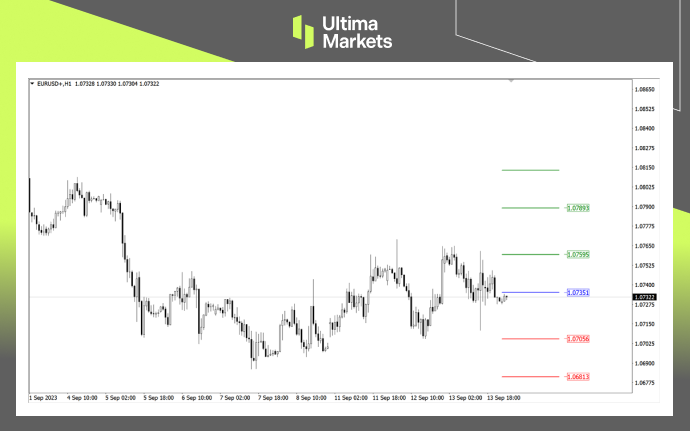
Ultima Markets Pivot Indicator
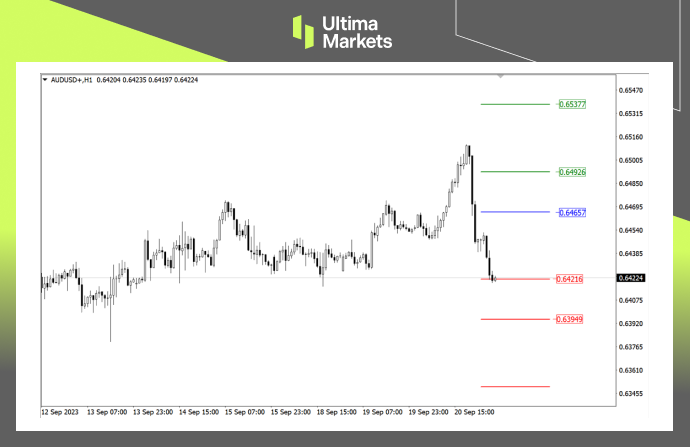
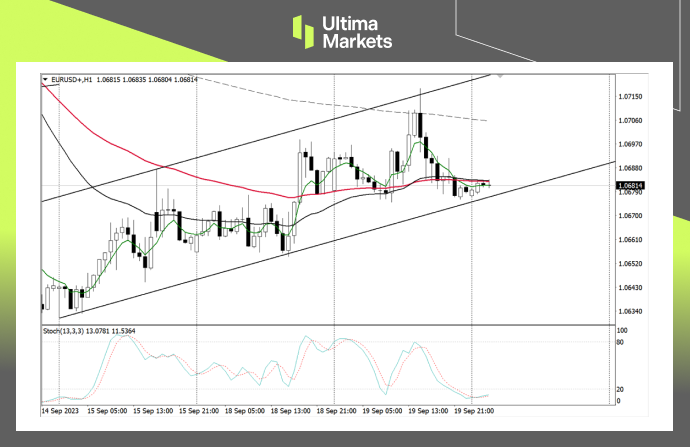
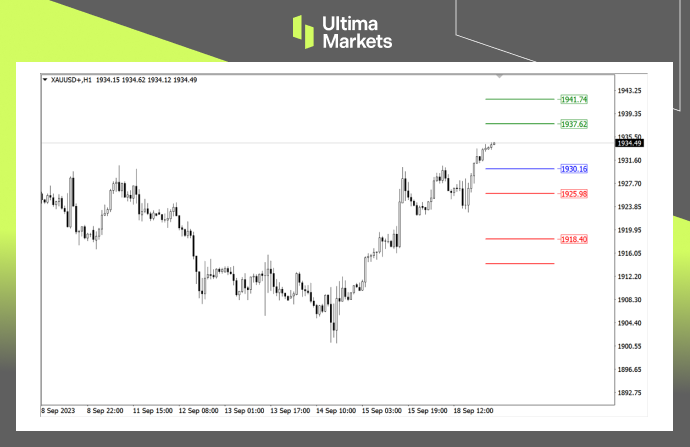
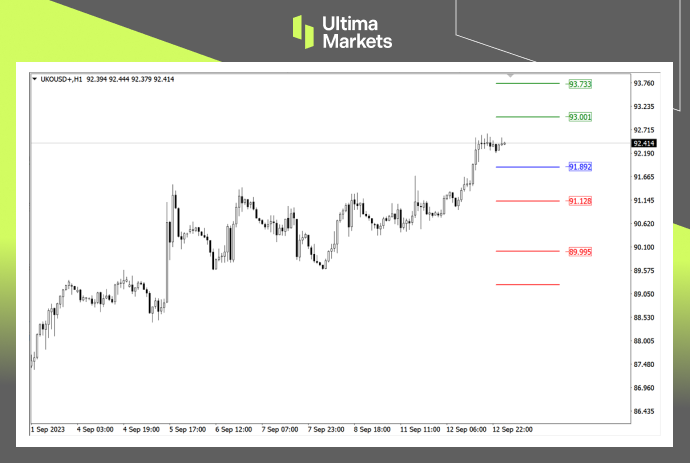
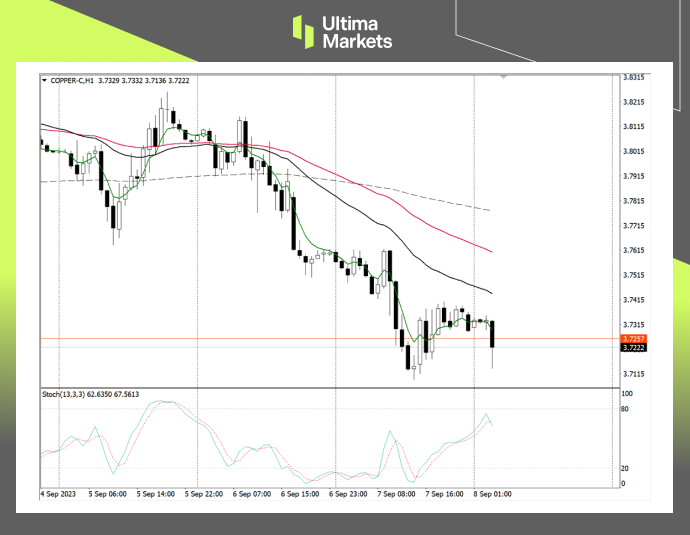
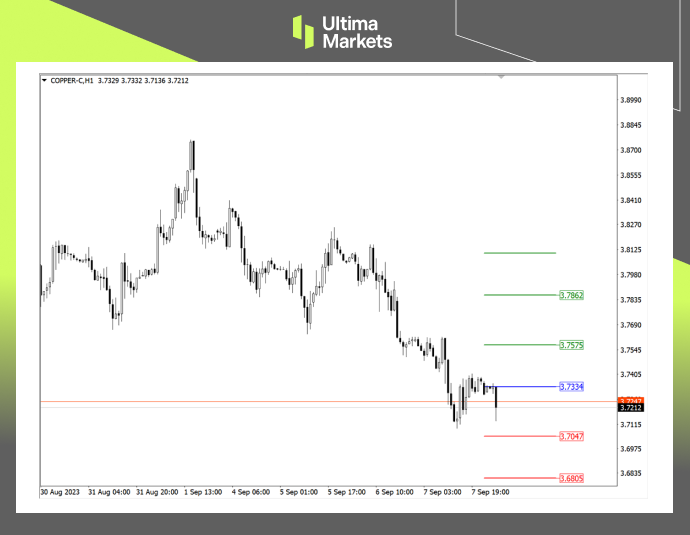
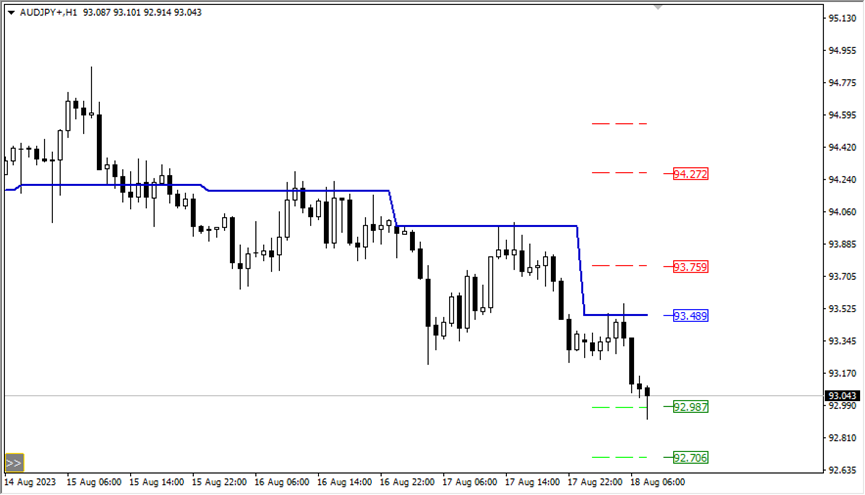
(1-hour chart of AUD/USD, source: Ultima Markets MT4)
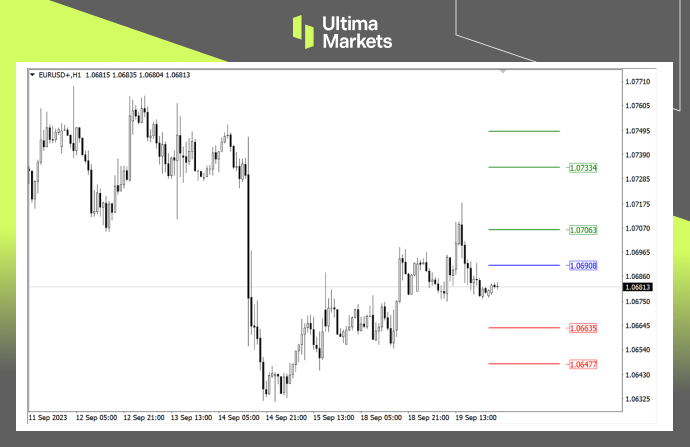
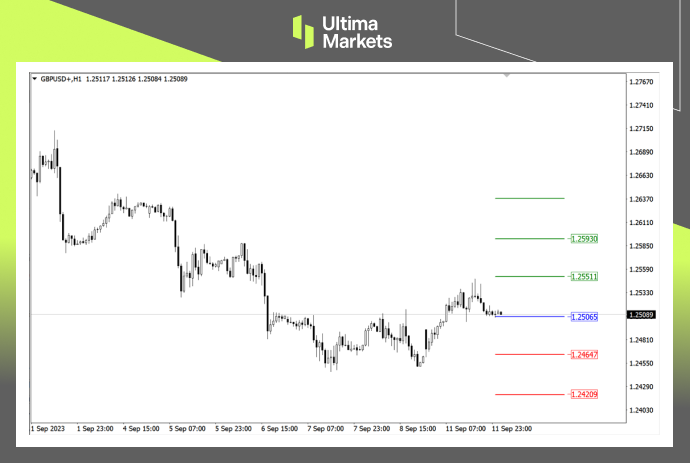
Ultima Markets MT4’s pivot indicator places the central price for the day at 0.64657. To assist your trading strategies, we outline bullish and bearish scenarios:
Bullish above 0.64657, targeting 0.64926 as the first objective and 0.65377 as the second.
Bearish below 0.64657, with the initial target set at 0.64216 and the subsequent target at 0.63949.